
Table of Contents
You’ve probably seen those smooth lines gliding across price charts. Maybe you’ve even tried using them. But here’s the truth: not all moving averages are created equal, and using the wrong one can turn a promising setup into a losing trade.
So what are the best moving averages for day trading? And more importantly, how do you use them effectively?
Why Moving Averages Matter for Day Traders
Before we dive into the “best” ones, let’s quickly cover why moving averages are so valuable in day trading.
At their core, moving averages smooth out price data over a specific time period. This helps filter out the noise of random price fluctuations and highlights the underlying trend.
For day traders, that’s gold. We’re not trying to predict the future—we’re trying to ride the momentum of the current trend. And moving averages help us spot that trend, confirm entries, and even act as dynamic support/resistance levels.
But here’s the catch:
The time frame and type of moving average you choose can make or break your strategy.
The 3 Types of Moving Averages
There are three main types:
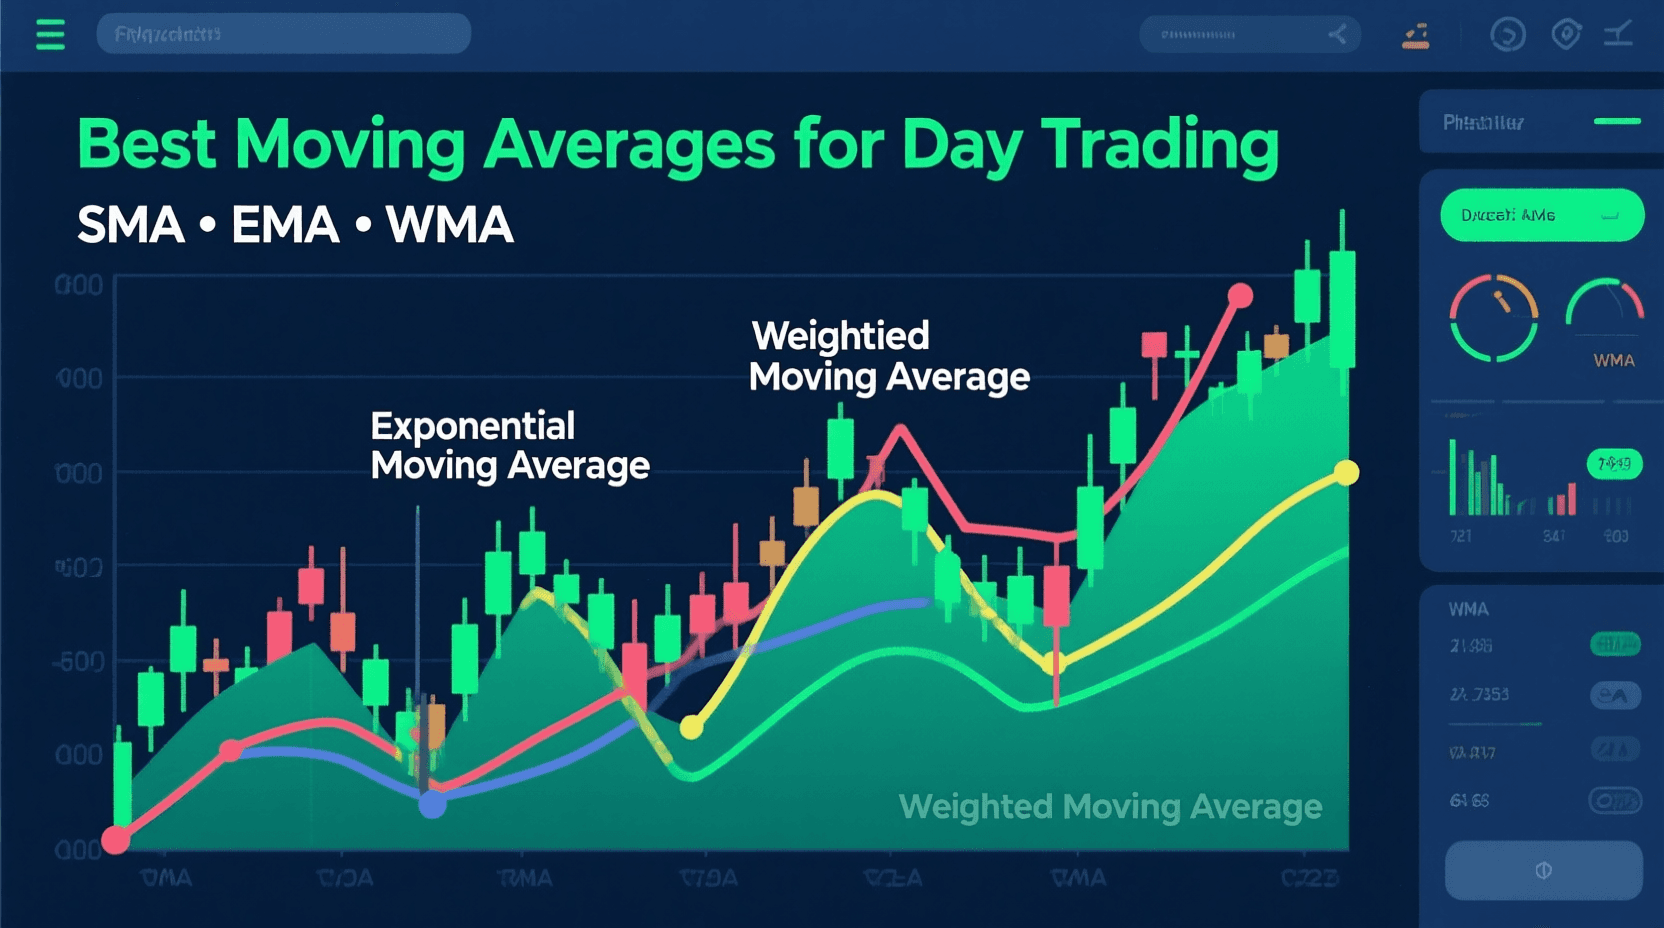
- Simple Moving Average (SMA)
Averages price over a set number of periods. Simple, but slow to react.
- Exponential Moving Average (EMA)
Gives more weight to recent prices. Faster and more responsive—perfect for day trading.
- Weighted Moving Average (WMA)
Similar to EMA but uses a linear weighting. Less common, but still useful in niche strategies.
Verdict? For day trading, EMA is the clear winner. It reacts faster to price changes, which is crucial when you’re making decisions in minutes—not days.
That said, SMAs still have their place, especially when used in combination with EMAs to confirm longer-term trends.
The Best Moving Averages for Day Trading: Top 5 Choices
After testing dozens of combinations across different markets, these are the moving averages that consistently deliver results.
1. 9 EMA – The Speed Demon
- Best for: Intraday momentum, scalping
- Time frames: 1-minute, 5-minute charts
- Why it works: The 9 EMA is ultra-responsive. It hugs price action tightly, making it perfect for catching early moves.
Many professional traders use the 9 EMA as a trend filter. If price is above the 9 EMA, they only look for long setups. If below, they focus on shorts.
👉 Pro tip: Combine with volume spikes for high-probability entries.
2. 20 EMA – The Day Trader’s Sweet Spot
- Best for: Swing within the day, trend continuation
- Time frames: 5-minute, 15-minute
- Why it works: The 20 EMA strikes a balance between responsiveness and reliability. It’s not too fast, not too slow—just right.
When price pulls back to the 20 EMA during a strong trend, it often bounces. This makes it a great dynamic support/resistance level.
I’ve personally used the 20 EMA to catch dozens of intraday breakouts in stocks like NVDA and TSLA.
3. 50 EMA – The Trend Validator
- Best for: Confirming the broader intraday trend
- Time frames: 15-minute, 30-minute
- Why it works: While not fast enough for entries, the 50 EMA helps you avoid trading against the dominant momentum.
If price is above the 50 EMA, the bias is bullish. Below? Bearish. Simple, but powerful.
Use it as a filter—only take long trades when price is above the 50 EMA, and vice versa.
4. 200 EMA – The Big Picture Gauge
- Best for: Identifying major intraday support/resistance
- Time frames: 15-minute and higher
- Why it works: The 200 EMA acts like a magnet. Price often respects it, especially during volatile sessions.
When the 200 EMA aligns with previous support/resistance or Fibonacci levels, it becomes a high-confluence area.
👉 Watch for reversals when price approaches the 200 EMA with strong momentum.
5. The 9 + 20 EMA Combo – The Power Duo
This is where things get fun.
Many top day traders use a dual EMA crossover strategy:
- 9 EMA (fast)
- 20 EMA (slow)
When the 9 crosses above the 20, it’s a bullish signal. When it crosses below, it’s bearish.
But don’t just trade every crossover—wait for confirmation:
- Volume spike
- Break of a key level
- Alignment with higher time frame trend
This combo works especially well in trending markets like during Fed days or earnings season.
How to Use Moving Averages Like a Pro (Not a Beginner)
Here’s the thing: just slapping EMAs on your chart won’t make you money.
You need a system. Here’s how I use them:
Step 1: Set Your Baseline
Add the 20 EMA and 50 EMA to your main chart (5- or 15-minute). These define the trend.
- Price above both? Look for longs.
- Price below both? Look for shorts.
- Mixed signals? Stay out—choppy market.
Step 2: Zoom In for Entries
Switch to a lower time frame (1- or 3-minute) and add the 9 EMA.
Look for pullbacks to the 9 EMA in the direction of the trend. That’s your entry zone.
Step 3: Confirm with Price Action
No indicator is perfect. Always check:
- Is there a bullish/bearish candlestick pattern?
- Did volume increase on the breakout?
- Is there a key level aligning with the EMA?
More confirmation = higher probability.
Step 4: Manage Risk
Use the EMA as a trailing stop.
- For longs: Exit if price closes below the 9 or 20 EMA.
- For shorts: Exit if price closes above.
This lets you ride trends while protecting profits.
Best Moving Averages by Market
Not all markets behave the same. Here’s how to tweak your approach:
| Market | Best Moving Averages | Notes |
|---|---|---|
| Stocks | 9 EMA, 20 EMA, 50 EMA | Works well with volume. Focus on pre-market leaders and momentum plays. |
| Forex | 20 EMA, 50 EMA | Best on 5M–15M charts. Combine with RSI or MACD for confirmation. |
| Crypto | 9 EMA, 20 EMA | High volatility means faster signals. Watch for fakeouts during low volume. |
Common Mistakes to Avoid
Even experienced traders mess this up. Don’t:
- Overload your chart with 10 different EMAs. Stick to 2–3 max.
- Trade every crossover—most are false signals in choppy markets.
- Ignore the bigger picture—always check the daily or 1-hour trend.
- Use the same settings for all markets—crypto needs faster EMAs than forex.
Final Thoughts: Keep It Simple, Stay Consistent
The best moving averages for day trading aren’t some secret, complex formula. They’re simple, proven tools: the 9 EMA, 20 EMA, and 50 EMA.
But here’s the real secret: consistency beats complexity.
Pick one or two combinations, test them in a demo account, refine your entries, and stick with it.
Moving averages won’t make you rich overnight. But used wisely, they can help you spot trends earlier, enter with better timing, and exit before the crowd gets crushed.
And in day trading? That’s an edge worth having.
So next time you’re staring at a chart, ask yourself:
Is price respecting the 20 EMA? Is the 9 crossing the 20?
If you can answer those, you’re already ahead of 80% of traders out there.
Now go test it. Your next winning trade might be just one EMA away.


Frequently Asked Questions (FAQs)
What is the best EMA for day trading?
The 9 EMA and 20 EMA are most popular. The 9 is great for quick entries, while the 20 acts as dynamic support/resistance.
Should I use SMA or EMA for day trading?
EMA is better for day trading because it reacts faster to price changes. SMA is slower and better suited for swing or position trading.
How many moving averages should I use?
Start with two: a fast EMA (like 9) and a slow EMA (like 20 or 50). More than three usually just clutters your chart.
Can moving averages predict price?
No. They’re lagging indicators, meaning they follow price. But they help identify trends and potential reversal zones when combined with other tools.
What time frame is best for EMA day trading?
5-minute and 15-minute charts are ideal. Use 1-minute for entries, and 30-minute or hourly to confirm the trend.
Do professional traders use moving averages?
Absolutely. Many hedge funds and prop traders use EMA-based strategies, especially in trending markets. It’s not “basic”—it’s battle-tested.
Legal Disclaimer
This article is for educational purposes only and does not constitute financial advice or a recommendation to buy or sell any specific securities. Always consult with a licensed financial advisor before making investment decisions. This post may include affiliate links. If you click and purchase, I may receive a small commission at no additional cost to you.

About Daniel M.
Founder of Nice Breakout
founder of Nice Breakout is a seasoned professional with over 5 years of dedicated experience navigating the intricacies of financial markets, particularly utilizing the Thinkorswim platform. His passion lies in empowering traders and investors by providing insightful analysis and cutting-edge tools.