
Advanced Volume Analysis
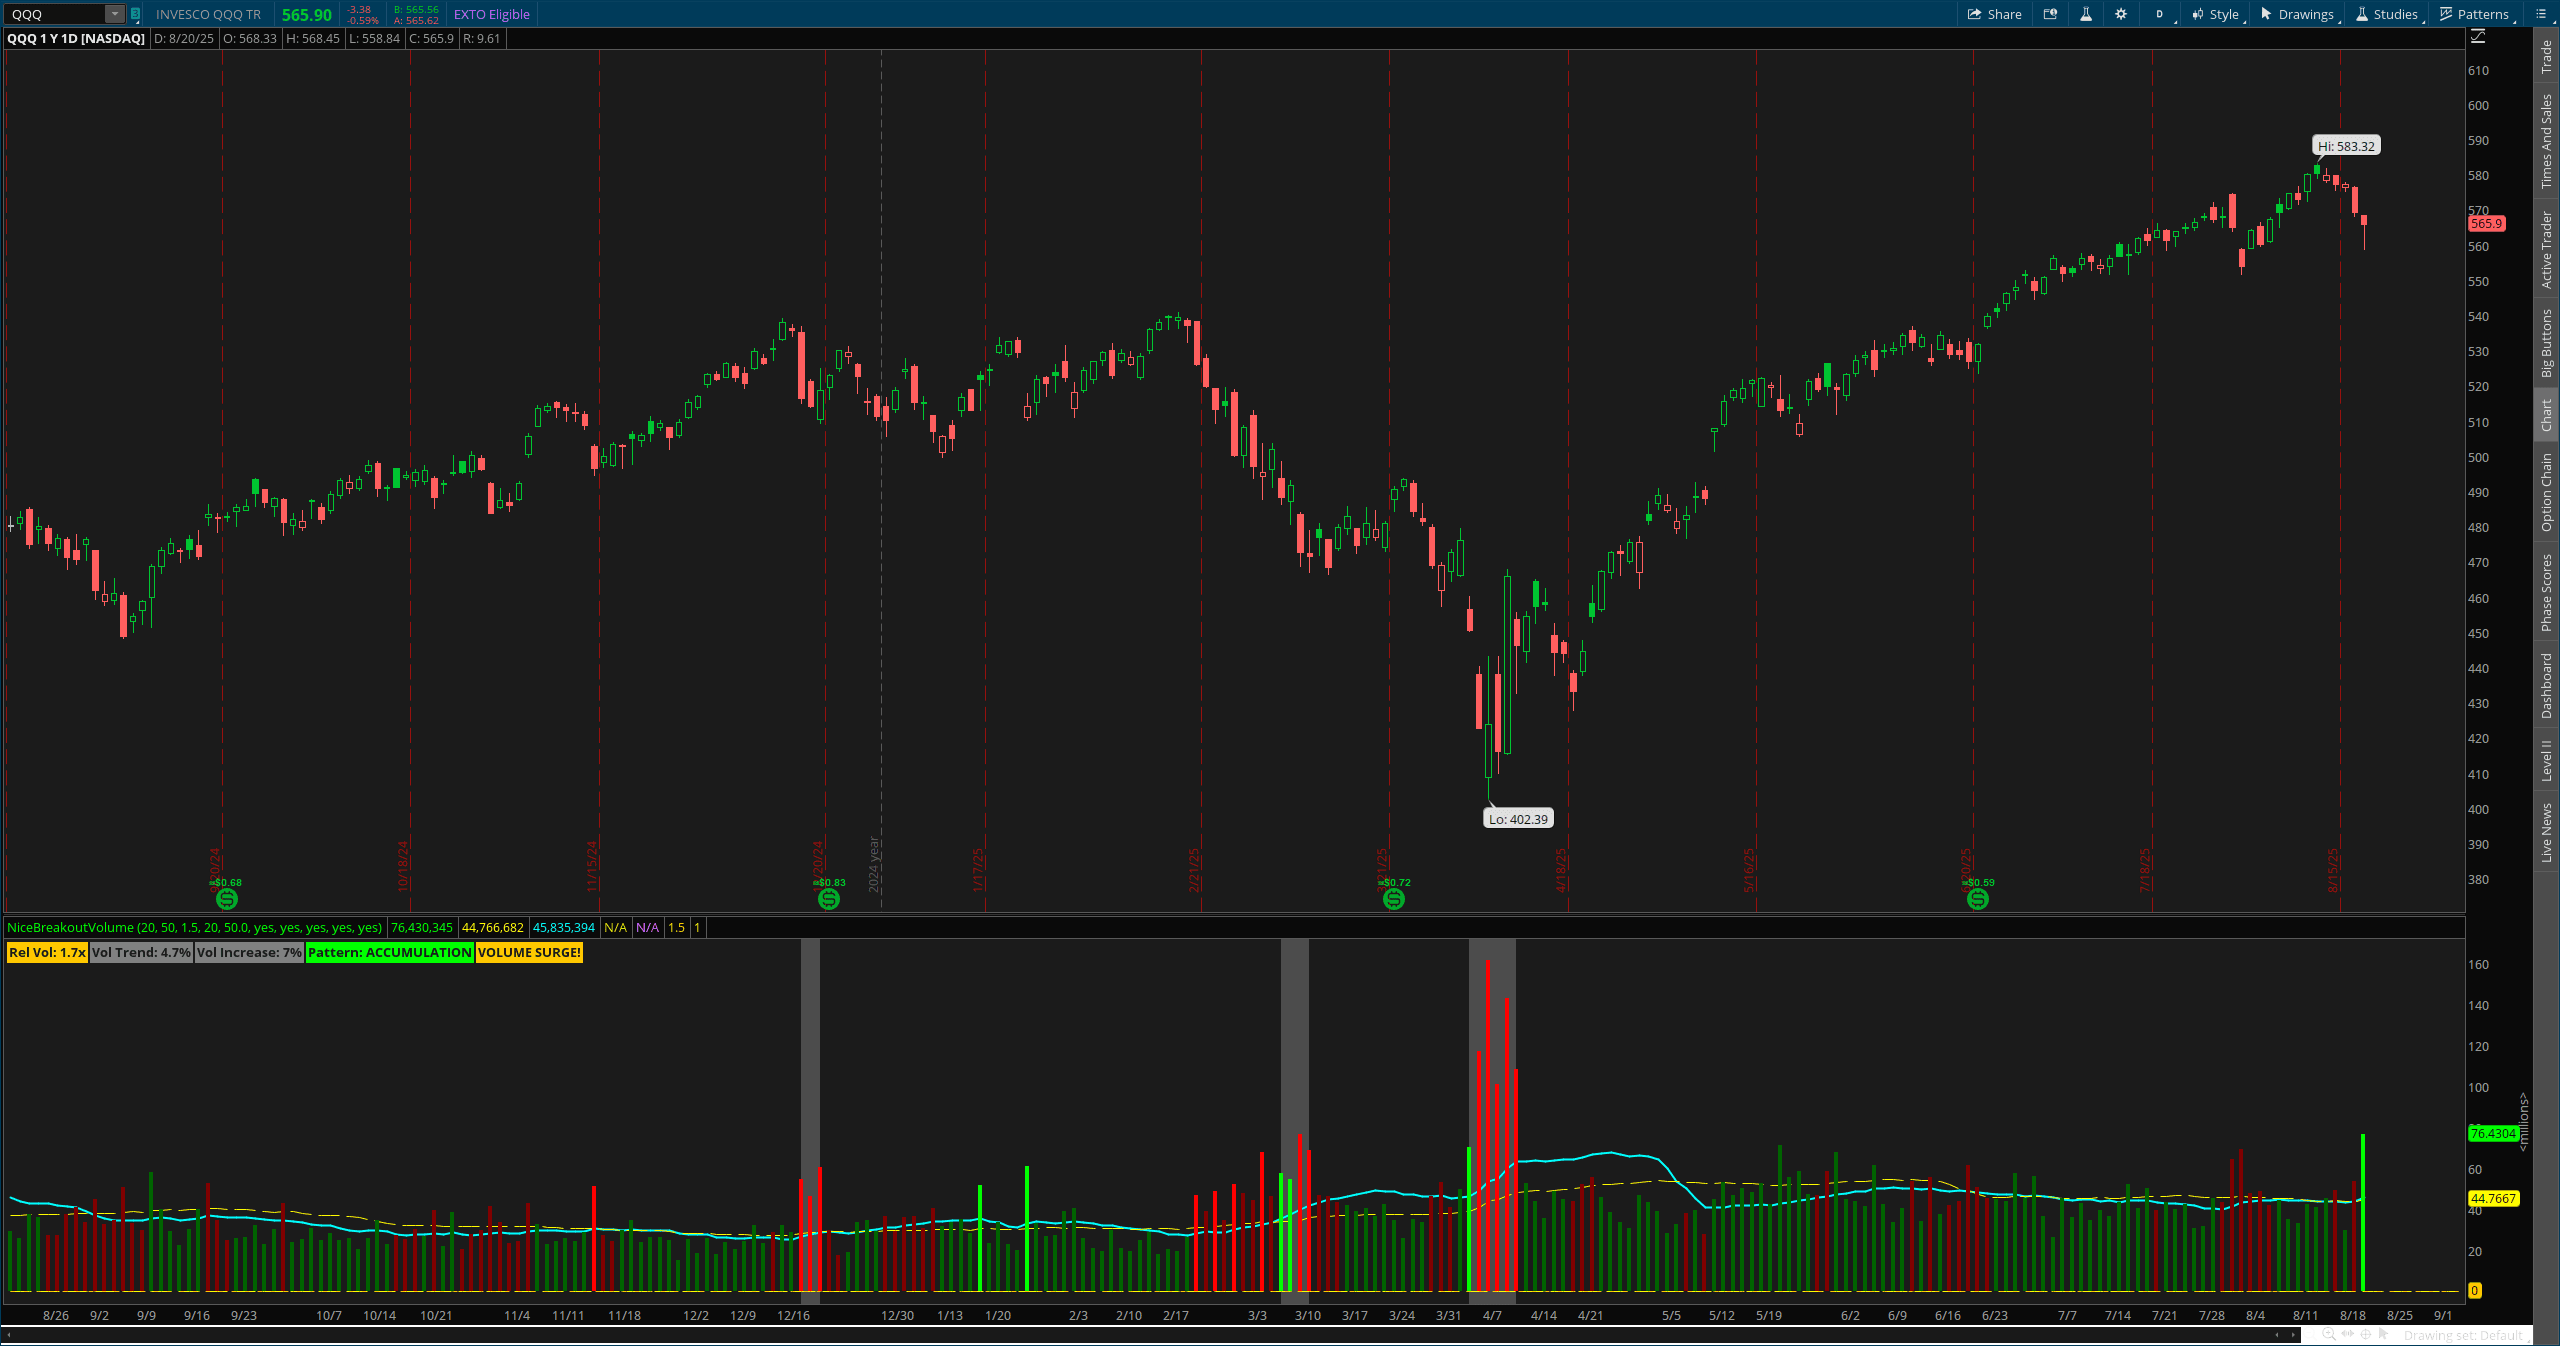
This Thinkorswim volume indicator that detects increasing volume patterns leading to price breakouts with smart accumulation/distribution analysis.
Indicator Code
thinkscript# Advanced Volume Analysis
#
# DESCRIPTION:
# Advanced volume-based indicator that identifies increasing volume patterns
# leading to price breakouts and breakdowns. Uses multiple volume analysis
# techniques including volume trend, relative volume, and accumulation/distribution
# to predict potential breakout scenarios.
#
# FEATURES:
# - Volume trend analysis with customizable lookback periods
# - Relative volume comparison to historical averages
# - Accumulation/Distribution detection
# - Breakout and breakdown signal generation
# - Volume surge detection with threshold alerts
# - Price level confirmation for breakout validation
# - Customizable visual alerts and color coding
#
# SIGNALS:
# - Green arrows: Bullish volume breakout (increasing volume + price breakout)
# - Red arrows: Bearish volume breakdown (increasing volume + price breakdown)
# - Volume bars colored by accumulation/distribution
# - Background highlighting during high relative volume periods
#
# PARAMETERS:
# - volumeTrendLength: Period for volume trend calculation (default: 20)
# - relativeVolumePeriod: Period for relative volume comparison (default: 50)
# - volumeSurgeThreshold: Minimum relative volume for surge detection (default: 1.5)
# - priceBreakoutPeriod: Period for price breakout detection (default: 20)
# - minVolumeIncrease: Minimum volume increase percentage for signal (default: 50)
#
# Author: Custom ThinkScript Study
# Version: 1.0 @Nicebreakout All Rights Reserved.
declare lower;
# Input Parameters
input volumeTrendLength = 20;
input relativeVolumePeriod = 50;
input volumeSurgeThreshold = 1.5;
input priceBreakoutPeriod = 20;
input minVolumeIncrease = 50.0;
input showVolumeBar = yes;
input showSignals = yes;
input showBackground = yes;
input showLabels = yes;
input alertOnBreakout = yes;
# Basic volume and price data
def vol = volume;
def high_price = high;
def low_price = low;
def close_price = close;
def open_price = open;
# Volume trend calculation
def volume_sma = SimpleMovingAvg(vol, volumeTrendLength);
def volume_trend_slope = (volume_sma - volume_sma[5]) / volume_sma[5] * 100;
# Relative volume calculation
def avg_volume = SimpleMovingAvg(vol, relativeVolumePeriod);
def relative_volume = if avg_volume > 0 then vol / avg_volume else 1;
# Volume surge detection
def volume_surge = relative_volume >= volumeSurgeThreshold;
# Volume trend strength (percentage increase over trend period)
def volume_increase_pct = if volume_sma[volumeTrendLength] > 0 then
(volume_sma - volume_sma[volumeTrendLength]) / volume_sma[volumeTrendLength] * 100 else 0;
# Price range and volatility
def price_range = high_price - low_price;
def typical_price = (high_price + low_price + close_price) / 3;
# Accumulation/Distribution calculation
def money_flow_multiplier = if price_range > 0 then
((close_price - low_price) - (high_price - close_price)) / price_range else 0;
def money_flow_volume = money_flow_multiplier * vol;
rec accumulation_distribution = accumulation_distribution[1] + money_flow_volume;
# Price breakout detection
def price_high_breakout = high_price > Highest(high_price[1], priceBreakoutPeriod);
def price_low_breakdown = low_price < Lowest(low_price[1], priceBreakoutPeriod);
# Volume-confirmed breakout conditions
def volume_increasing = volume_increase_pct >= minVolumeIncrease;
def strong_volume = relative_volume >= volumeSurgeThreshold;
# Signal generation
def bullish_volume_breakout = price_high_breakout and volume_increasing and strong_volume;
def bearish_volume_breakdown = price_low_breakdown and volume_increasing and strong_volume;
# Volume characterization
def accumulating = accumulation_distribution > accumulation_distribution[5];
def distributing = accumulation_distribution < accumulation_distribution[5];
# Volume bar plotting
plot VolumeBar = if showVolumeBar then vol else Double.NaN;
VolumeBar.SetPaintingStrategy(PaintingStrategy.HISTOGRAM);
VolumeBar.SetLineWeight(2);
VolumeBar.AssignValueColor(
if bullish_volume_breakout then Color.LIME
else if bearish_volume_breakdown then Color.MAGENTA
else if accumulating and volume_surge then Color.GREEN
else if distributing and volume_surge then Color.RED
else if volume_surge then Color.ORANGE
else if accumulating then Color.DARK_GREEN
else if distributing then Color.DARK_RED
else Color.GRAY
);
# Average volume line
plot AvgVolume = if showVolumeBar then avg_volume else Double.NaN;
AvgVolume.SetDefaultColor(Color.YELLOW);
AvgVolume.SetStyle(Curve.LONG_DASH);
AvgVolume.SetLineWeight(1);
# Volume trend line
plot VolumeTrend = if showVolumeBar then volume_sma else Double.NaN;
VolumeTrend.SetDefaultColor(Color.CYAN);
VolumeTrend.SetLineWeight(2);
# Signal arrows on volume bars
plot BullishSignal = if showSignals and bullish_volume_breakout then vol * 1.1 else Double.NaN;
BullishSignal.SetPaintingStrategy(PaintingStrategy.ARROW_UP);
BullishSignal.SetDefaultColor(Color.LIME);
BullishSignal.SetLineWeight(3);
plot BearishSignal = if showSignals and bearish_volume_breakdown then vol * 1.1 else Double.NaN;
BearishSignal.SetPaintingStrategy(PaintingStrategy.ARROW_DOWN);
BearishSignal.SetDefaultColor(Color.MAGENTA);
BearishSignal.SetLineWeight(3);
# Background coloring for high volume periods
AddCloud(if showBackground and volume_surge then Double.POSITIVE_INFINITY else Double.NaN,
Double.NEGATIVE_INFINITY, Color.LIGHT_GRAY, Color.LIGHT_GRAY);
# Information labels
AddLabel(showLabels, "Rel Vol: " + Round(relative_volume, 1) + "x",
if relative_volume >= 2.0 then Color.LIME
else if relative_volume >= 1.5 then Color.ORANGE
else Color.Magenta);
AddLabel(showLabels, "Vol Trend: " + Round(volume_trend_slope, 1) + "%",
if volume_trend_slope > 20 then Color.GREEN
else if volume_trend_slope < -20 then Color.RED
else Color.GRAY);
AddLabel(showLabels, "Vol Increase: " + Round(volume_increase_pct, 0) + "%",
if volume_increase_pct >= minVolumeIncrease then Color.GREEN else Color.GRAY);
AddLabel(showLabels, "Pattern: " +
(if accumulating then "ACCUMULATION"
else if distributing then "DISTRIBUTION"
else "NEUTRAL"),
if accumulating then Color.GREEN
else if distributing then Color.RED
else Color.GRAY);
AddLabel(showLabels and volume_surge, "VOLUME SURGE!", Color.ORANGE);
AddLabel(showLabels and bullish_volume_breakout, "BULLISH BREAKOUT", Color.LIME);
AddLabel(showLabels and bearish_volume_breakdown, "BEARISH BREAKDOWN", Color.MAGENTA);
# Alert conditions
Alert(alertOnBreakout and bullish_volume_breakout, "Bullish Volume Breakout Detected!", Alert.BAR, Sound.DING);
Alert(alertOnBreakout and bearish_volume_breakdown, "Bearish Volume Breakdown Detected!", Alert.BAR, Sound.DING);
# Additional volume strength indicator
plot VolumeStrength = relative_volume;
VolumeStrength.SetPaintingStrategy(PaintingStrategy.LINE);
VolumeStrength.SetDefaultColor(Color.Magenta);
VolumeStrength.SetLineWeight(1);
VolumeStrength.Hide();
# Reference lines for volume thresholds
plot SurgeThresholdLine = volumeSurgeThreshold;
SurgeThresholdLine.SetDefaultColor(Color.ORANGE);
SurgeThresholdLine.SetStyle(Curve.SHORT_DASH);
plot AverageVolumeLine = 1.0;
AverageVolumeLine.SetDefaultColor(Color.YELLOW);
AverageVolumeLine.SetStyle(Curve.LONG_DASH);Original Author Credit
Created by: NiceBreakout
Website: https://www.Nicebreakout.com
Open ThinkorSwim and go to Charts > Studies (fx).
Click Edit Studies > then Create New Study.
Name your indicator (e.g., "My Custom Indicator").
Paste the ThinkScript code into the editor.
Click OK, then Apply to add it to your chart.
Adjust parameters based on your trading style
Initial Setup (Recommended Settings)
Volume Trend Length: 20 (for most timeframes)
Relative Volume Period: 50 (standard baseline)
Volume Surge Threshold: 1.5 (moderate sensitivity)
Price Breakout Period: 20 (matches volume trend)
Minimum Volume Increase: 50% (filters weak signals)
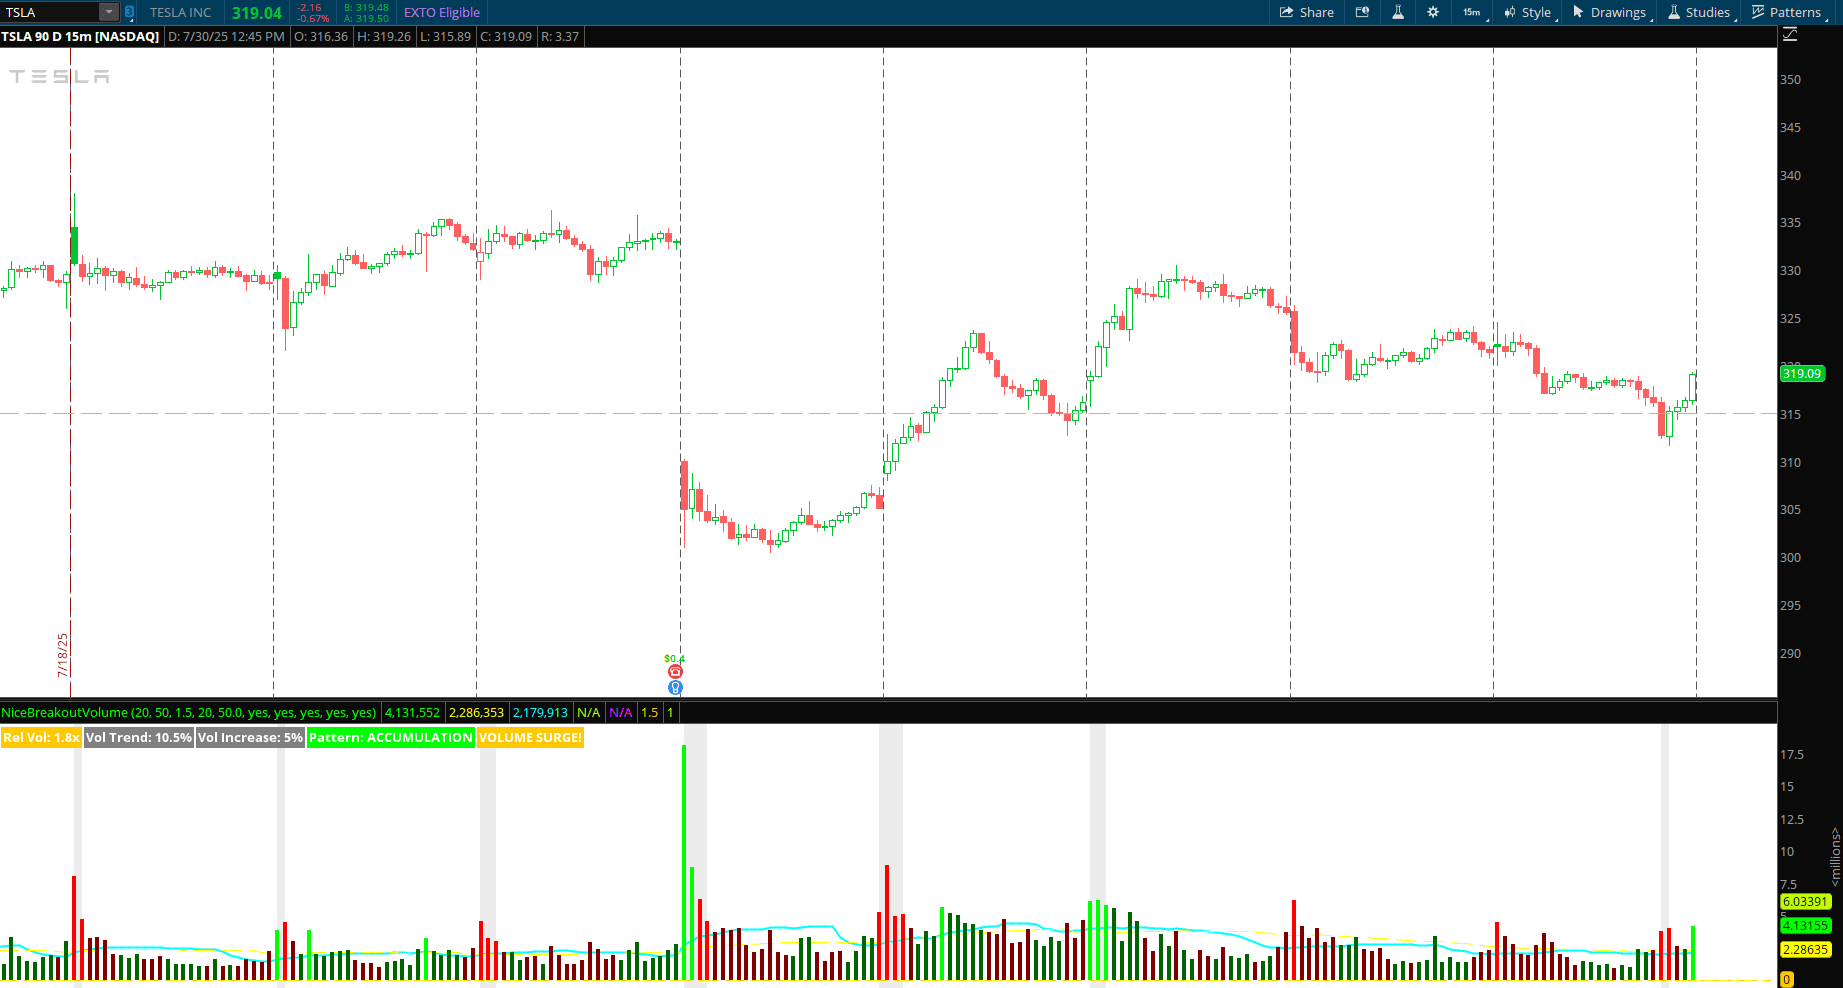
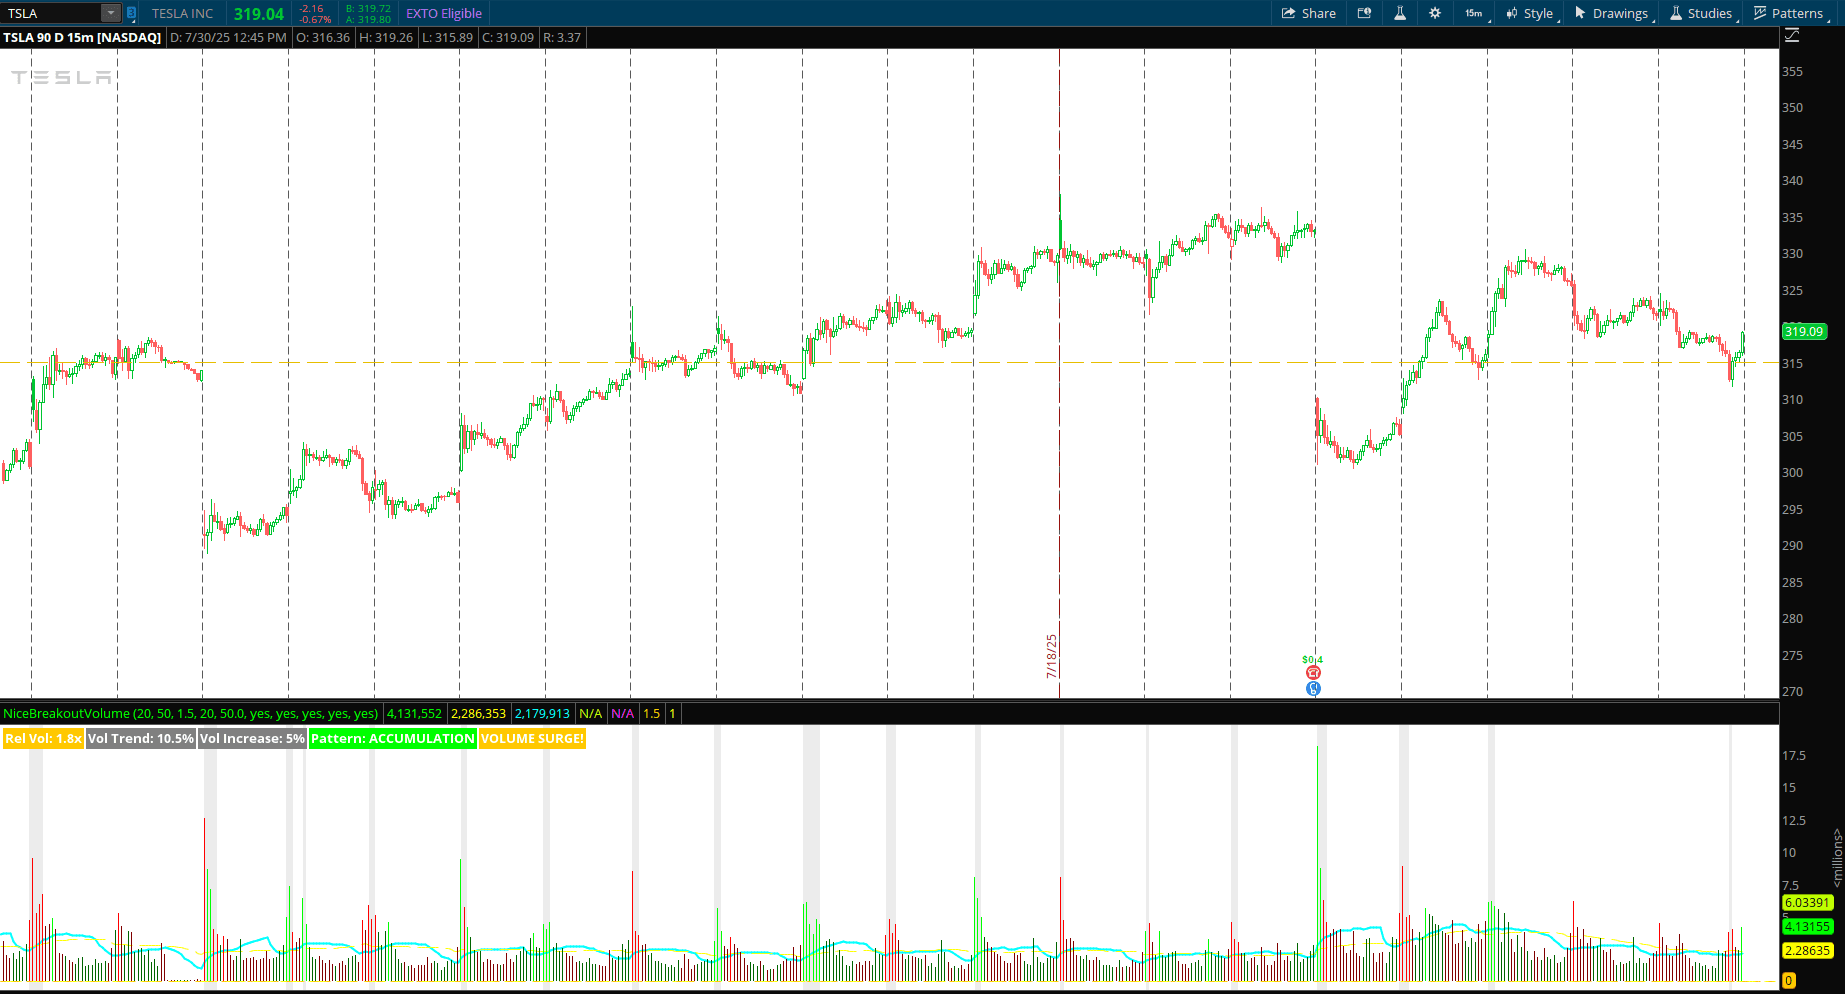
First Look Checklist
✅ Volume bars appear in lower panel
✅ Yellow dashed line shows average volume
✅ Orange dashed line shows surge threshold
✅ Labels display current statistics
✅ Background highlights during volume surges
Understanding the Indicator
Core Concepts
1. Relative Volume Analysis
What it measures: Current volume compared to recent average
Why it matters: Shows when unusual activity is occurring
Key threshold: 1.5x = significant, 2.0x+ = exceptional
Interpretation: Higher ratios suggest institutional interest
2. Volume Trend Detection
What it measures: Whether volume is increasing over time
Why it matters: Identifies building pressure before breakouts
Key metric: Percentage increase over trend period
Interpretation: +50% increase often precedes major moves
3. Accumulation/Distribution
What it measures: Whether volume is accumulating (bullish) or distributing (bearish)
Why it matters: Reveals institutional buying/selling behavior
Key signals:
Accumulation = Smart money buying
Distribution = Smart money selling
4. Price Breakout Confirmation
What it measures: Price breaking above/below recent ranges
Why it matters: Confirms volume signals with actual price movement
Key requirement: Volume surge + price breakout = high-probability signal
How Signals Are Generated
Signal Requirements Matrix
Signal TypeVolume SurgeVolume TrendPrice ActionPatternBullish Breakout✅ Above threshold✅ Increasing✅ Break above high✅ AccumulationBearish Breakdown✅ Above threshold✅ Increasing✅ Break below low✅ Distribution
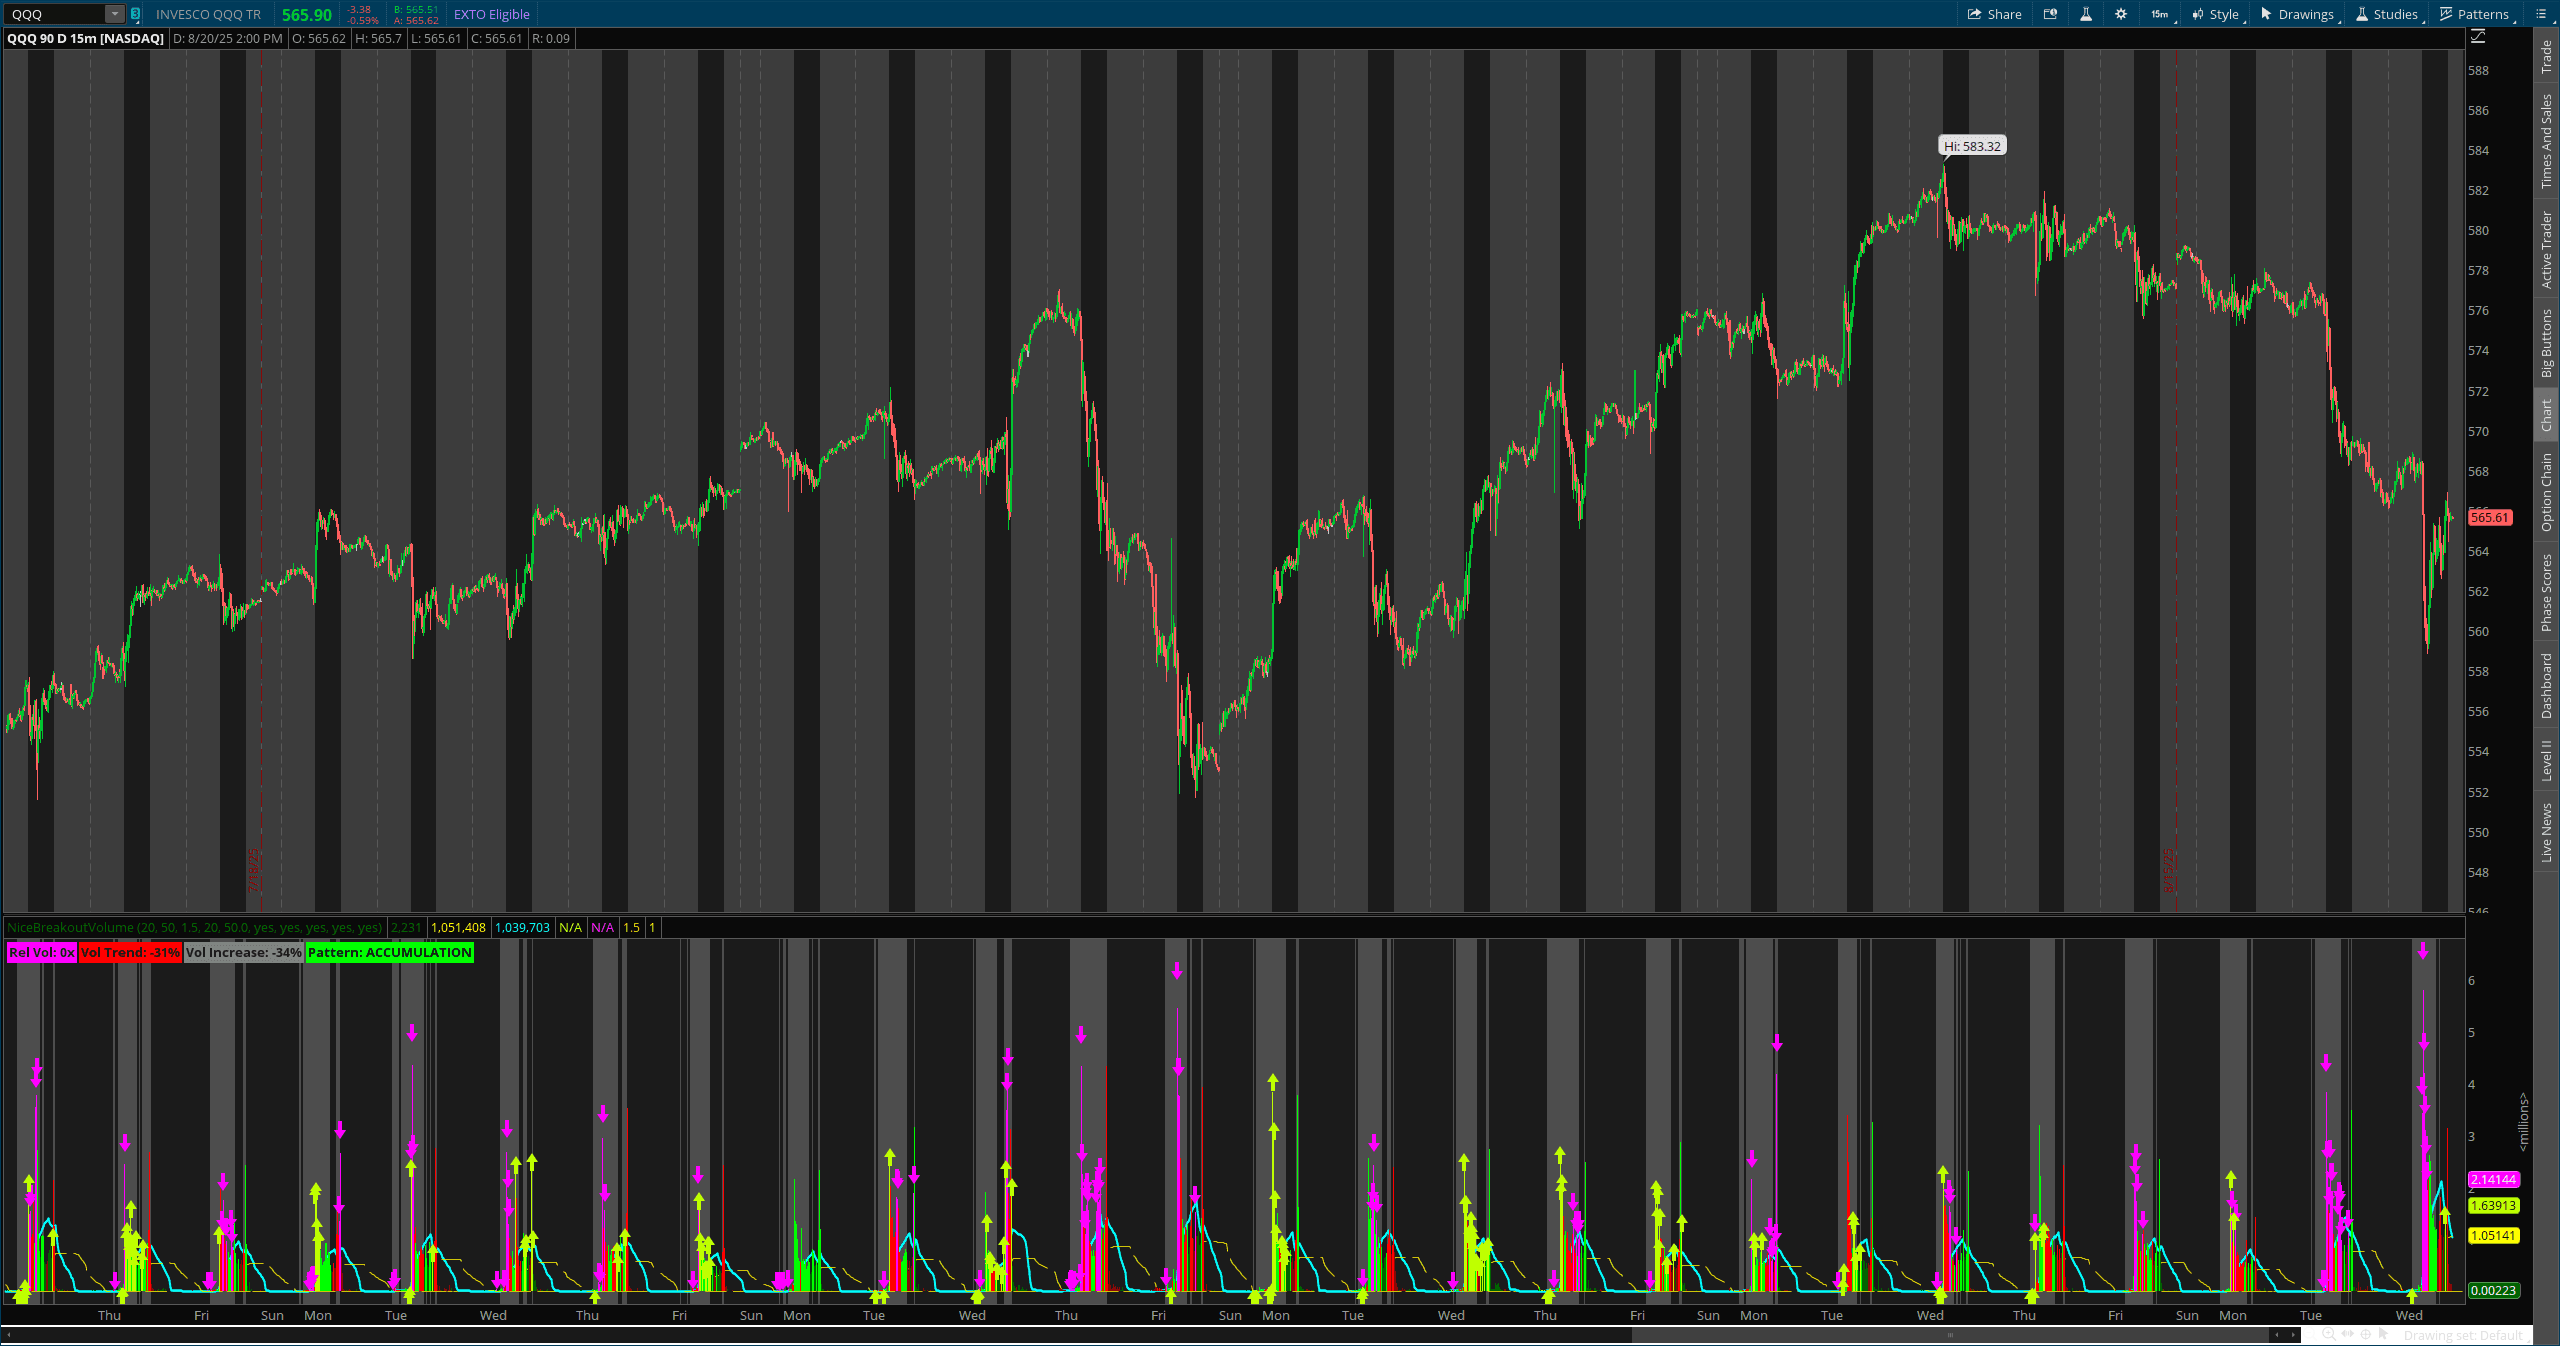
Visual Signal Reference
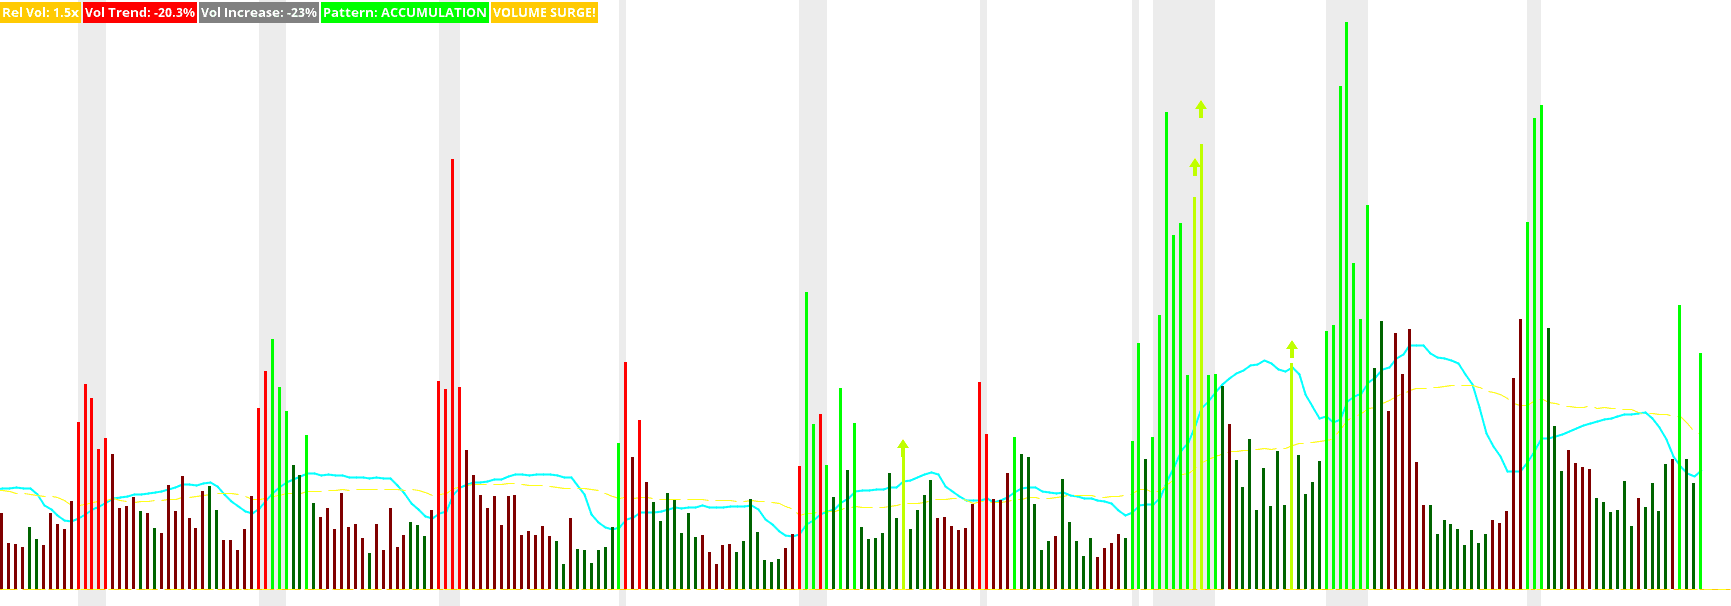
Volume Bar Color Coding
🟢 Green Bars - Accumulation with Volume Surge
Meaning: Strong buying interest with high volume
Action: Look for bullish continuation or reversal
Context: Often appears during uptrends or at support levels
🔴 Red Bars - Distribution with Volume Surge
Meaning: Strong selling interest with high volume
Action: Look for bearish continuation or reversal
Context: Often appears during downtrends or at resistance levels
🟠 Orange Bars - General Volume Surge
Meaning: High volume without clear accumulation/distribution
Action: Wait for directional clarity
Context: Often appears during consolidation breakouts
🟢 Lime Bars - Confirmed Bullish Breakout
Meaning: All bullish conditions met
Action: Consider long positions
Context: High-probability bullish signal
🟣 Magenta Bars - Confirmed Bearish Breakdown
Meaning: All bearish conditions met
Action: Consider short positions
Context: High-probability bearish signal
⚪ Gray Bars - Normal Volume
Meaning: Standard volume activity
Action: No immediate volume-based signals
Context: Wait for volume increase
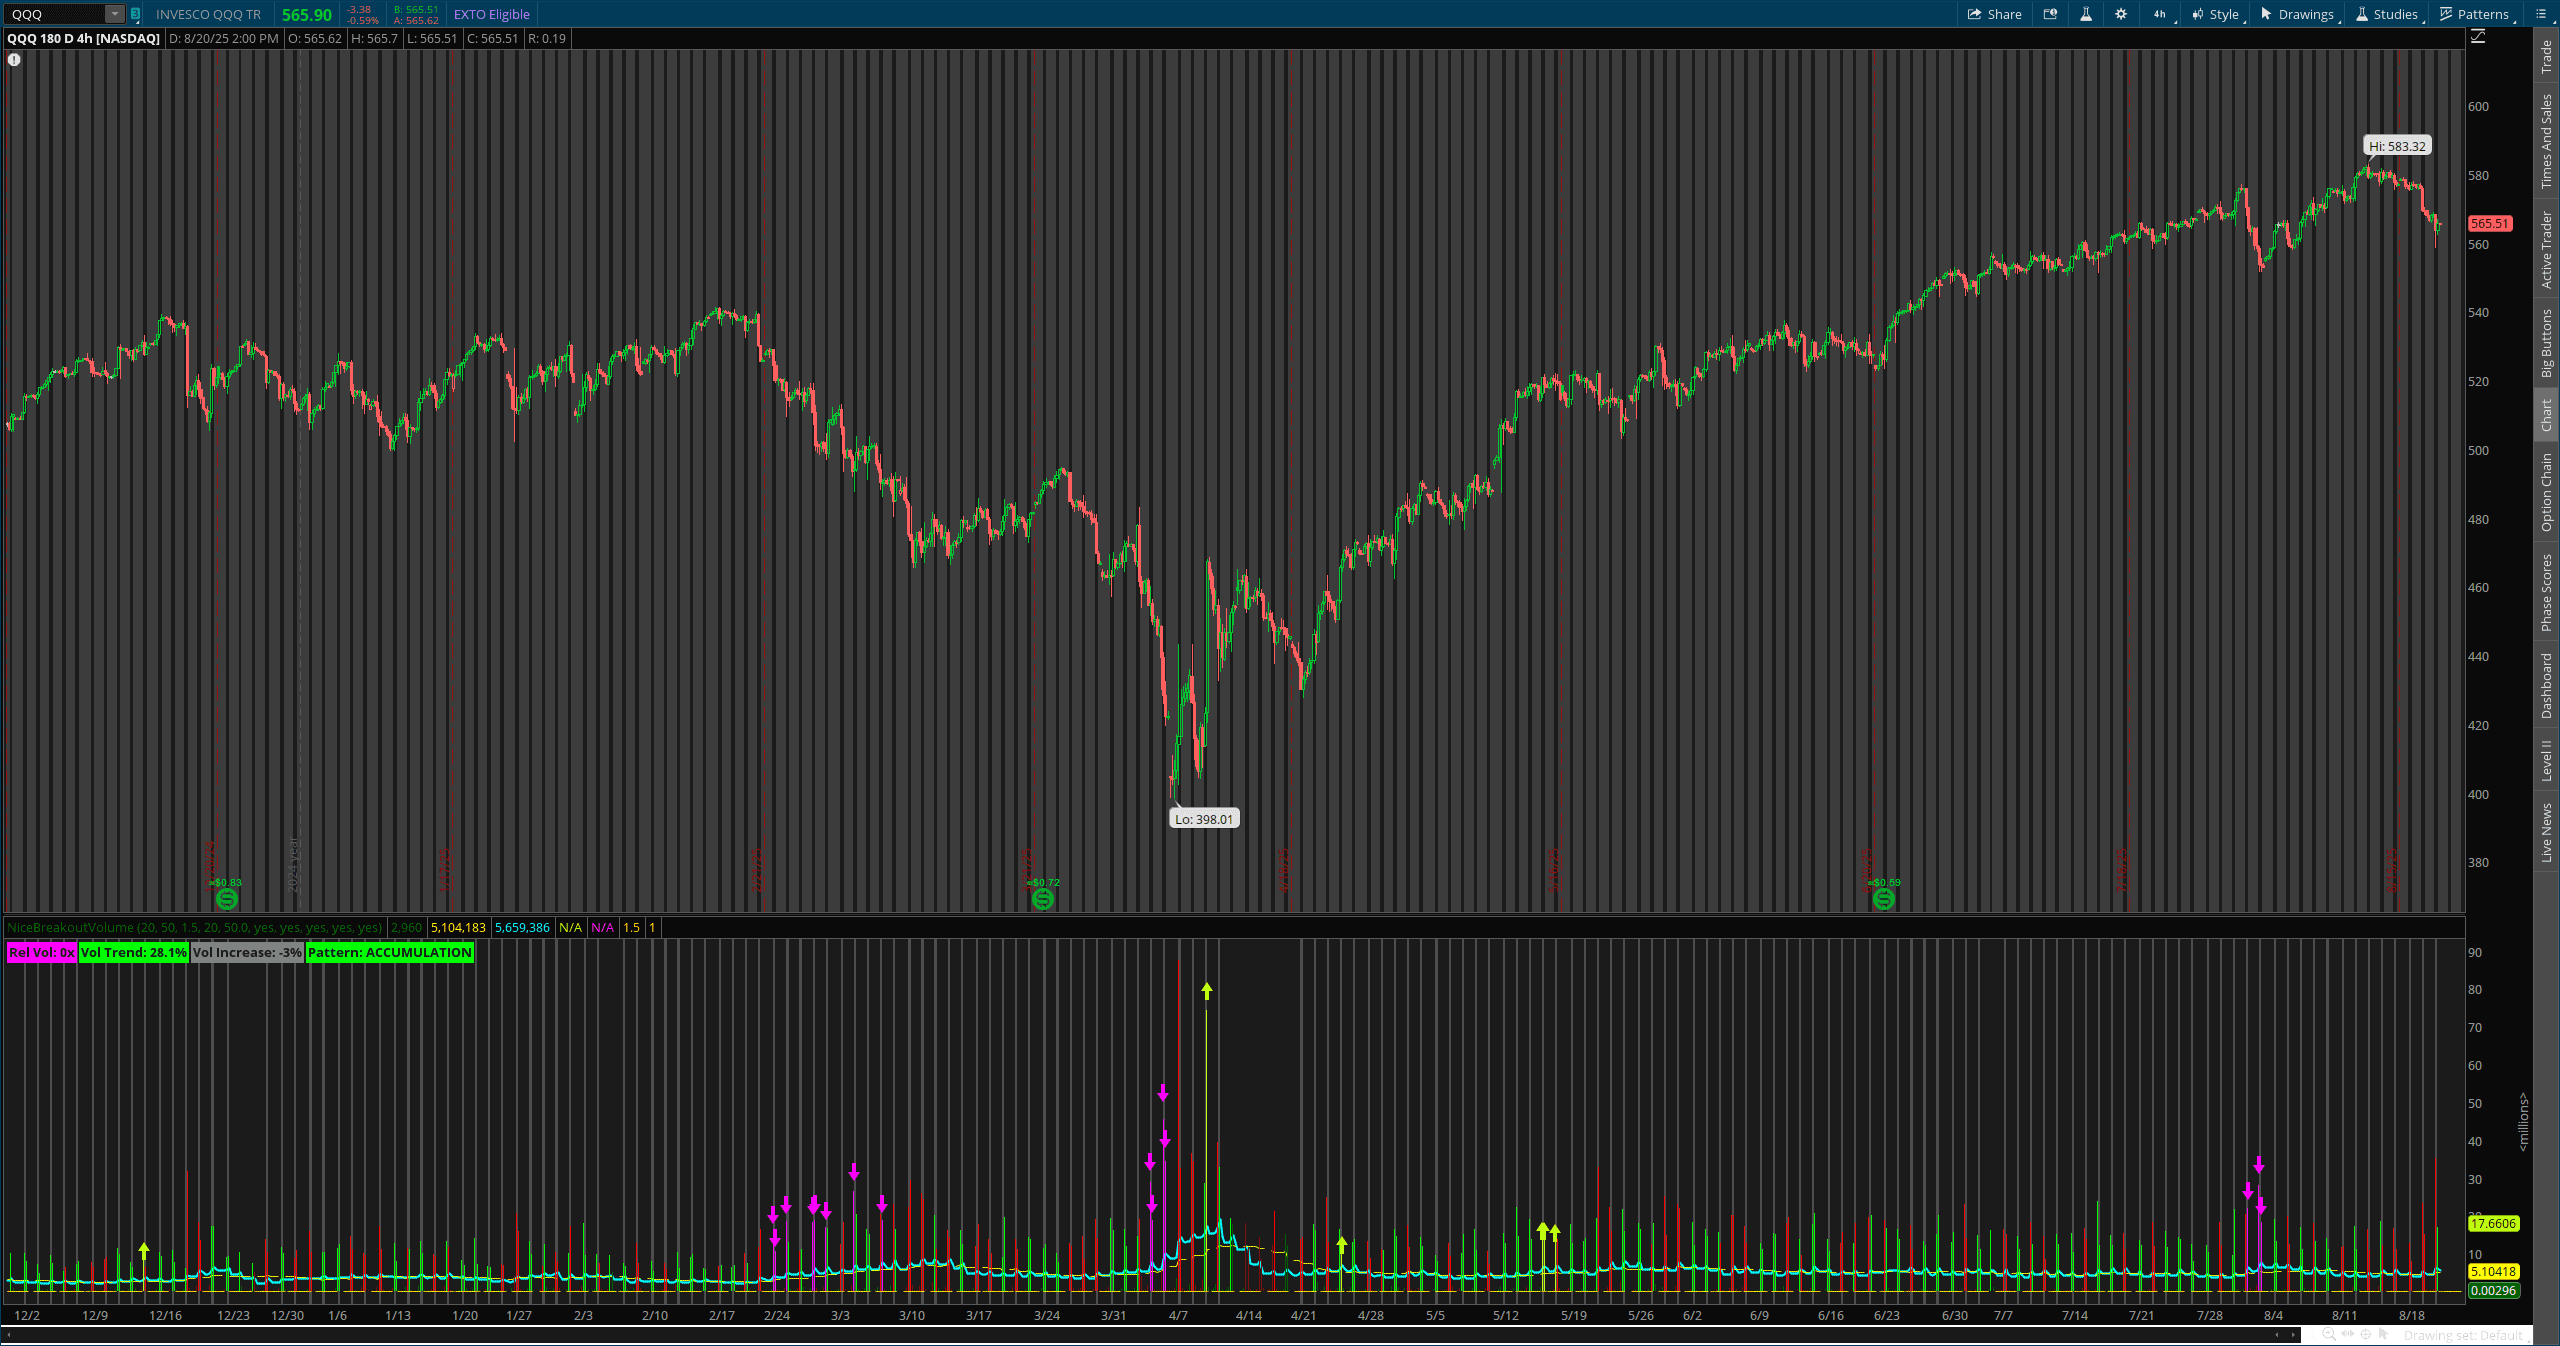
Arrow Signals
⬆️ Lime Up Arrows
Trigger: Bullish breakout confirmed
Requirements: Volume surge + price breakout up + accumulation
Action: Strong buy signal
Stop Loss: Below recent swing low
⬇️ Magenta Down Arrows
Trigger: Bearish breakdown confirmed
Requirements: Volume surge + price breakdown + distribution
Action: Strong sell signal
Stop Loss: Above recent swing high
Background Highlighting
🔍 Light Gray Background
Meaning: Volume surge period active
Purpose: Easy identification of high-volume zones
Usage: Focus attention on potential breakout areas
Reference Lines
📊 Yellow Dashed Line (Average Volume)
Value: 1.0x relative volume
Purpose: Shows normal volume baseline
Usage: Volume above this line = above average
📊 Orange Dashed Line (Surge Threshold)
Value: Your threshold setting (default 1.5x)
Purpose: Shows minimum volume for surge signals
Usage: Volume above this line = surge condition met
Parameter Optimization
For Different Trading Styles
Day Trading Settings
Volume Trend Length: 10-15 (faster response)
Relative Volume Period: 20-30 (recent baseline)
Volume Surge Threshold: 2.0+ (filter noise)
Price Breakout Period: 10-15 (short-term levels)
Minimum Volume Increase: 75%+ (strong signals only)
Swing Trading Settings
Volume Trend Length: 20-30 (standard)
Relative Volume Period: 50 (balanced baseline)
Volume Surge Threshold: 1.5 (moderate sensitivity)
Price Breakout Period: 20-30 (key levels)
Minimum Volume Increase: 50% (good balance)
Position Trading Settings
Volume Trend Length: 50+ (long-term trends)
Relative Volume Period: 100+ (historical context)
Volume Surge Threshold: 1.2-1.3 (capture subtle changes)
Price Breakout Period: 50+ (major levels)
Minimum Volume Increase: 25% (gradual accumulation)
Market Condition Adjustments
High Volatility Markets
Increase surge threshold (2.0x+)
Increase minimum volume increase (75%+)
Decrease trend length (10-15)
Reason: Filter out noise from elevated activity
Low Volatility Markets
Decrease surge threshold (1.2-1.3x)
Decrease minimum volume increase (25-35%)
Increase trend length (30-50)
Reason: Catch subtle institutional activity
Trending Markets
Standard surge threshold (1.5x)
Focus on accumulation/distribution patterns
Use longer breakout periods (30+)
Reason: Confirm trend continuation vs. reversal
Range-Bound Markets
Increase surge threshold (2.0x+)
Decrease breakout periods (10-15)
Focus on breakout confirmation
Reason: Identify true breakouts from ranges
Trading Strategies
Strategy 1: Volume Breakout Momentum
Best for: Day trading, swing trading
Timeframes: 5min, 15min, 1hr
Entry Rules
Wait for lime up arrow (bullish) or magenta down arrow (bearish)
Confirm relative volume > 1.5x
Enter on the signal bar or next bar open
Volume trend must show +50% increase
Exit Rules
Stop Loss: Beyond recent swing high/low
Profit Target: 2:1 or 3:1 risk/reward ratio
Trailing Stop: Move stop to breakeven after 1:1 gain
Risk Management
Position Size: 1-2% risk per trade
Max Concurrent: 3 positions
Daily Loss Limit: 6% of account
Strategy 2: Accumulation/Distribution Swing
Best for: Swing trading, position trading
Timeframes: 1hr, 4hr, daily
Entry Rules - Accumulation Phase
Identify sustained green volume bars (accumulation)
Wait for volume trend increase +25% over 20+ bars
Enter on price breakout above consolidation
Confirm with bullish arrow signal
Entry Rules - Distribution Phase
Identify sustained red volume bars (distribution)
Wait for volume trend increase +25% over 20+ bars
Enter on price breakdown below consolidation
Confirm with bearish arrow signal
Position Management
Initial Stop: 8-10% below entry
Add to Winners: On pullbacks to breakout level
Hold Time: 2-8 weeks typical
Strategy 3: Volume Climax Reversal
Best for: Contrarian trading
Timeframes: 15min, 1hr, 4hr
Setup Identification
Extended Move: Price in strong trend for 10+ bars
Volume Surge: Relative volume spikes to 3.0x+
Exhaustion Signs: Price action slows despite high volume
Reversal Confirmation: Opposite color volume bars appear
Entry Technique
Wait for volume surge climax
Enter on first opposite-direction signal
Target return to mean (moving average)
Real-World Examples
Example 1: Bullish Breakout (SPY)
Setup: Consolidation at resistance level
Signal Sequence:
Day 1-5: Accumulation (green bars increasing)
Day 6: Volume surge to 2.1x average
Day 7: Price breaks above resistance + lime arrow
Day 8-12: Follow-through rally (+8.5%)
Key Lessons:
Accumulation preceded breakout by several days
Volume confirmation was essential
Early entry provided best risk/reward
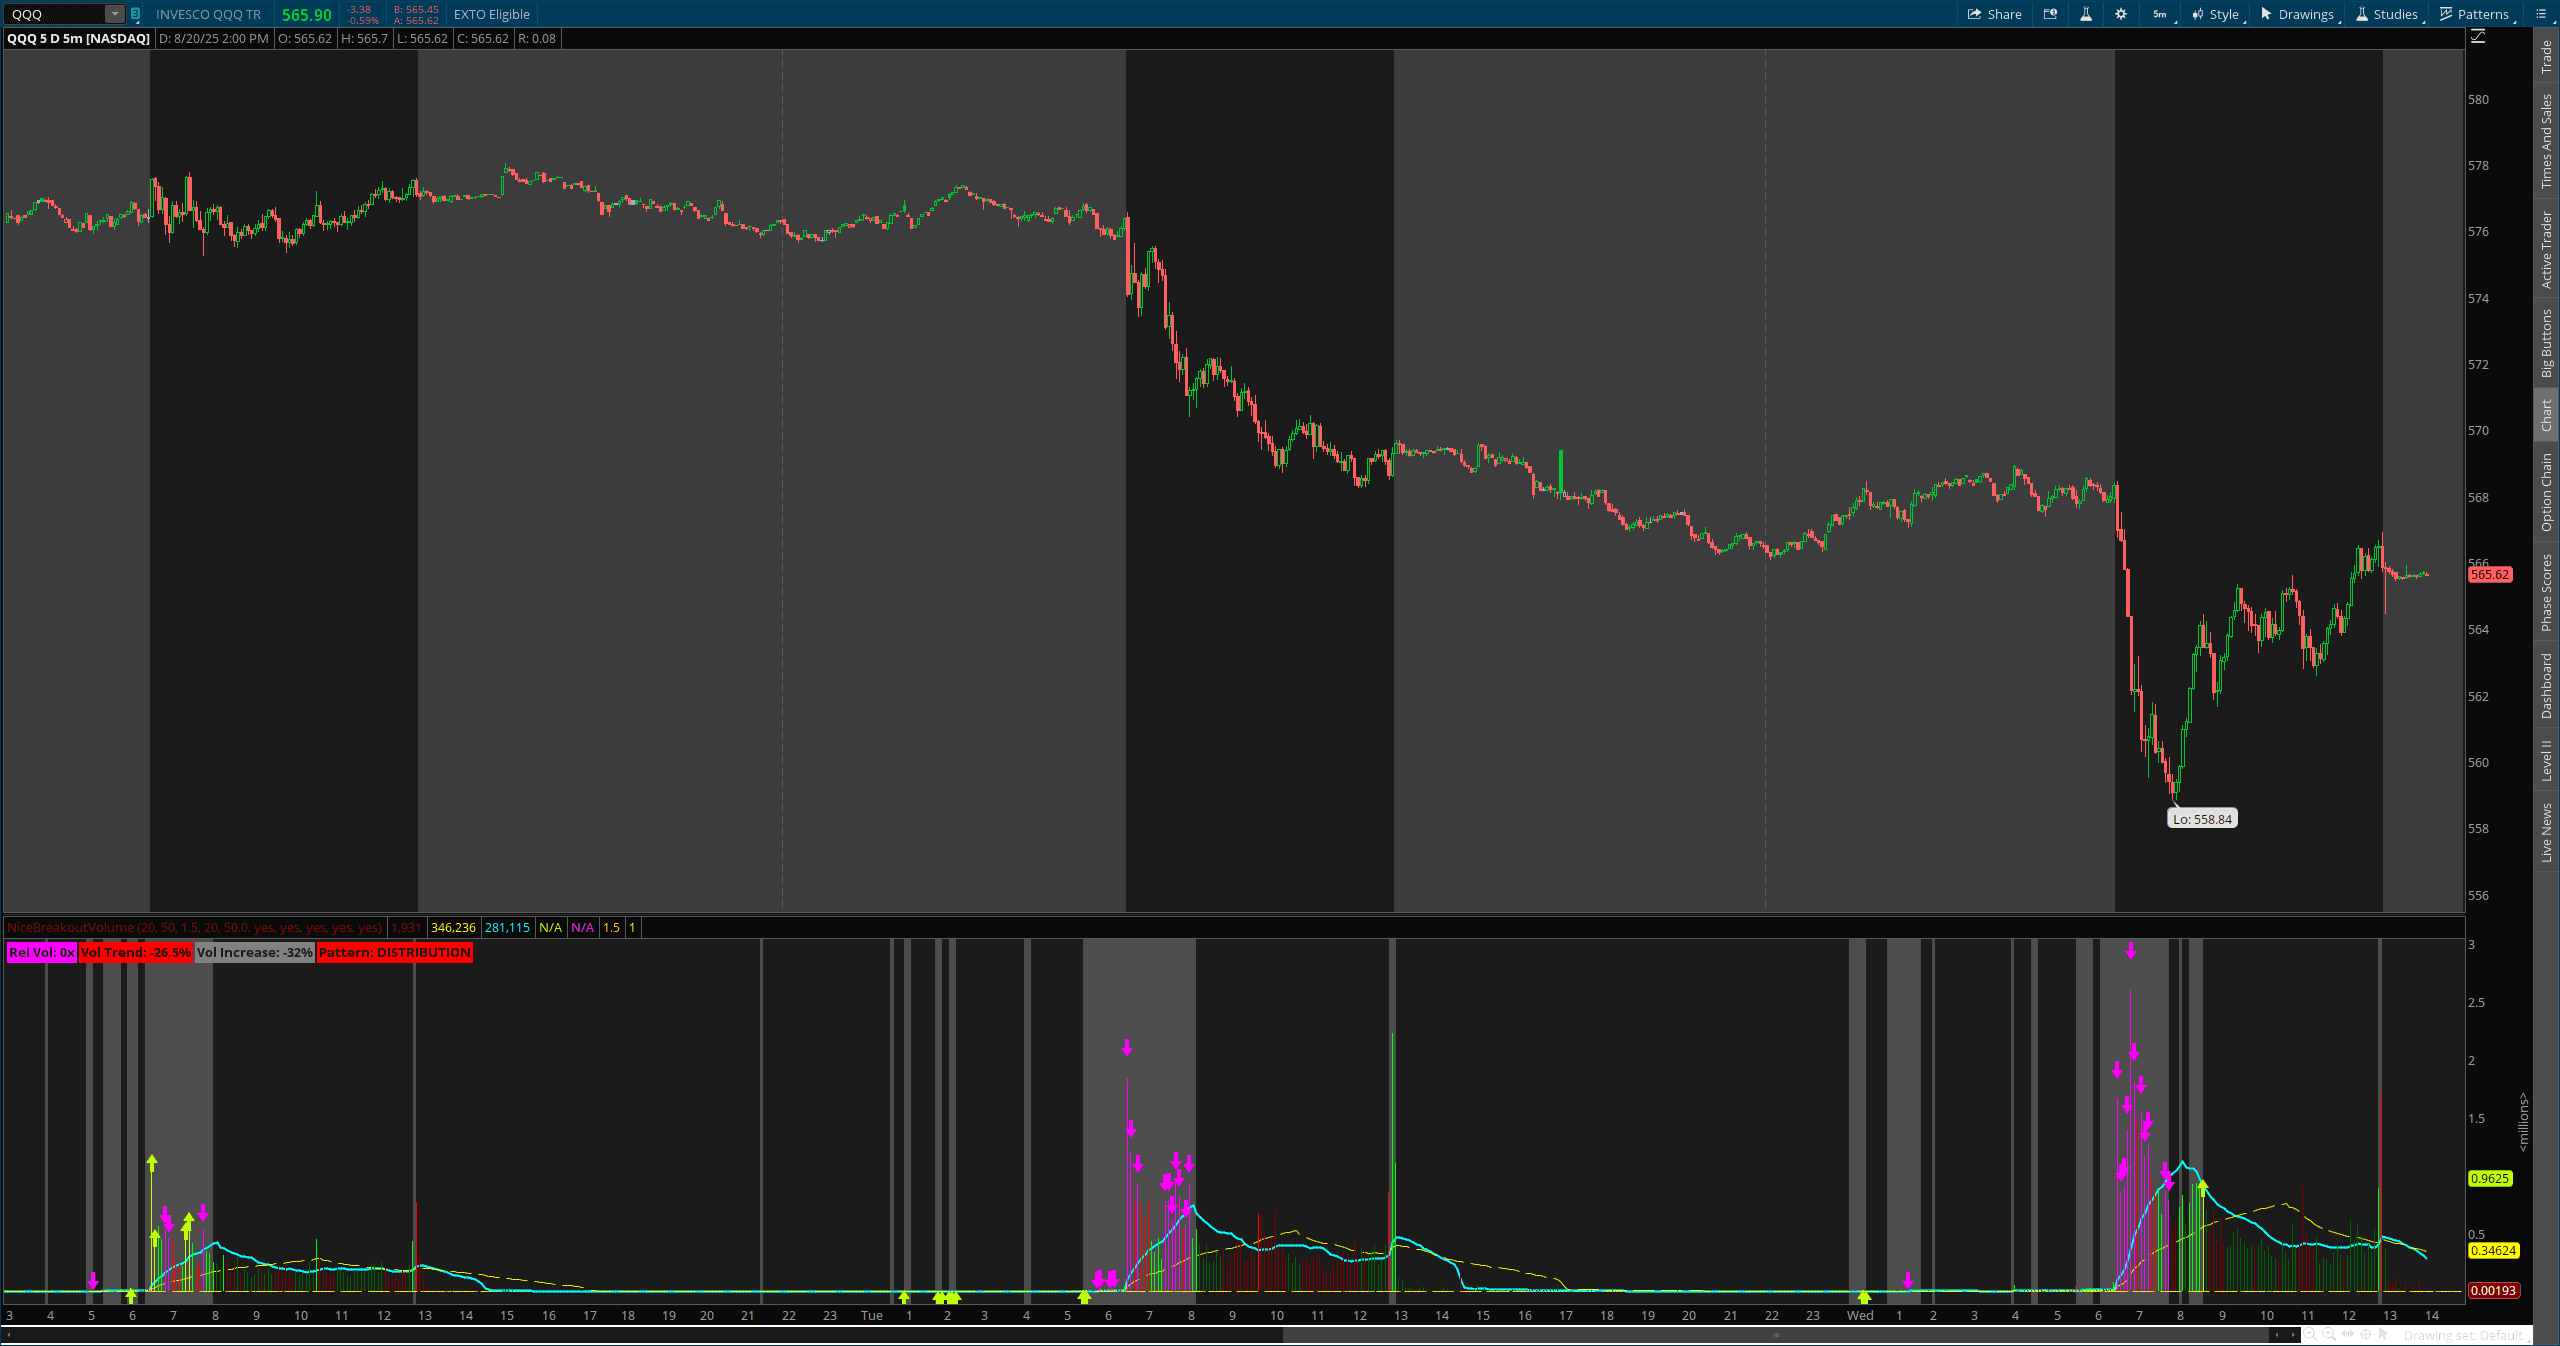
Example 2: Bearish Breakdown (QQQ)
Setup: Distribution at support level
Signal Sequence:
Week 1-2: Distribution pattern (red bars)
Week 3: Volume trend +67% increase
Week 3 End: Support break + magenta arrow
Following month: Sustained decline (-12.3%)
Key Lessons:
Distribution was gradual but persistent
Volume increase preceded major decline
Signal provided early warning
Example 3: False Breakout (AAPL)
Setup: Price breaks resistance but fails
What Happened:
Price broke above resistance
Volume was only 1.1x average (below threshold)
No arrow signal generated
Price quickly reversed back into range
Key Lessons:
Volume confirmation prevented false signal
Indicator's filtering worked as designed
Saved trader from poor entry
Common Mistakes to Avoid
Mistake 1: Ignoring Volume Context
❌ Wrong: Taking signals without checking relative volume
✅ Right: Only act on signals with volume surge confirmation
Why: Low volume breakouts often fail
Mistake 2: Chasing Late Signals
❌ Wrong: Entering after price has already moved significantly
✅ Right: Enter on signal bar or immediately after
Why: Risk/reward deteriorates with delay
Mistake 3: Over-Optimizing Parameters
❌ Wrong: Constantly adjusting settings for perfect historical results
✅ Right: Use standard settings across different markets
Why: Over-optimization leads to curve fitting
Mistake 4: Ignoring Market Context
❌ Wrong: Taking all signals regardless of market conditions
✅ Right: Adjust strategy based on volatility and trend
Why: Market conditions affect signal reliability
Mistake 5: No Risk Management
❌ Wrong: Using same position size for all signals
✅ Right: Adjust size based on signal strength and market conditions
Why: Risk management is crucial for long-term success
Advanced Techniques
Multi-Timeframe Analysis
Higher Timeframe: Check daily/weekly for major trend
Entry Timeframe: Use hourly for signal generation
Execution Timeframe: Use 15min for precise entry
Confirmation: All timeframes should align
Volume Profile Integration
Combine with volume profile levels
Look for breakouts at high-volume price levels
Use volume profile as additional confirmation
Sector Rotation Strategy
Scan multiple sectors for volume signals
Identify which sectors showing accumulation
Focus trading on strongest volume patterns
Rotate capital to sectors with best signals
News Event Trading
Pre-earnings: Look for accumulation patterns
Economic releases: Watch for immediate volume spikes
Sector news: Monitor affected stocks for volume changes
Algorithm Detection
Identify algorithmic volume patterns
Look for unusual volume spikes at round numbers
Trade with or against algorithmic flows
Troubleshooting
Common Issues and Solutions
Issue: No signals appearing
Possible Causes:
Threshold set too high
Market in low-volatility period
Timeframe too short for settings
Solutions:
Lower volume surge threshold to 1.2x
Increase relative volume period
Switch to longer timeframe
Issue: Too many false signals
Possible Causes:
Threshold set too low
High-volatility market conditions
Parameters not suited to current market
Solutions:
Raise volume surge threshold to 2.0x+
Increase minimum volume increase to 75%
Add additional confirmation filters
Issue: Signals appearing too late
Possible Causes:
Volume trend length too long
Breakout period too long
Settings optimized for longer timeframes
Solutions:
Reduce volume trend length to 10-15
Reduce breakout period to 10-15
Use faster-responding parameters
Issue: Volume bars not showing properly
Possible Causes:
Chart settings conflict
Study applied as upper study
Volume data unavailable
Solutions:
Apply as lower study only
Check data feed for volume information
Restart ThinkOrSwim platform
Performance Optimization
For Faster Response
Reduce all period lengths by 30-50%
Increase surge threshold to filter noise
Focus on shorter-term breakouts
For More Reliable Signals
Increase all period lengths by 50-100%
Add multiple confirmation requirements
Use longer-term breakout validation
For Different Market Conditions
Bull Market: Focus on accumulation patterns
Bear Market: Focus on distribution patterns
Sideways Market: Increase breakout thresholds
Final Tips for Success
1. Start with Default Settings
Don't immediately change parameters. Use defaults for at least 50 trades to understand behavior.
2. Keep a Trading Journal
Document which signals work best in different market conditions.
3. Practice on Paper First
Test strategies without real money until consistently profitable.
4. Combine with Price Action
Use volume signals to confirm price-based setups, not replace them.
5. Stay Disciplined
Follow your rules consistently. Don't abandon strategy after few losses.
6. Regular Review
Weekly review of performance and market conditions for continuous improvement.
7. Risk Management First
Never risk more than you can afford to lose on any single trade.
Remember: No indicator is perfect. Use this tool as part of a complete trading system, not as a standalone solution.
The Advanced Volume Analysis is a sophisticated ThinkOrSwim indicator designed to identify high-probability breakout and breakdown scenarios by analyzing volume patterns that precede significant price movements. This indicator goes beyond simple volume analysis by incorporating multiple volume-based signals to provide traders with early warning systems for potential explosive price moves.
Key Features
Smart Volume Analysis
- Relative Volume Comparison: Compares current volume to historical averages (50-period default)
- Volume Trend Detection: Tracks volume increases over customizable periods (20-period default)
- Volume Surge Identification: Automatically detects when volume exceeds 1.5x average (customizable threshold)
- Progressive Volume Monitoring: Identifies sustained volume increases leading to breakouts
Accumulation/Distribution Intelligence
- Money Flow Analysis: Calculates accumulation vs. distribution based on price action within each bar
- Smart Money Tracking: Identifies institutional buying/selling patterns through volume flow analysis
- Pattern Recognition: Distinguishes between accumulation (bullish) and distribution (bearish) phases
- Trend Confirmation: Uses volume characteristics to confirm price trend validity
Breakout/Breakdown Detection
- Price Level Confirmation: Validates volume signals with actual price breakouts above/below key levels
- Multi-Timeframe Analysis: Analyzes volume patterns across your selected timeframe
- Signal Filtering: Requires both volume surge AND price breakout for high-confidence signals
- False Signal Reduction: Advanced filtering reduces whipsaws and noise
Visual Signal System
- Color-Coded Volume Bars:
- Green: Accumulation with volume surge
- Red: Distribution with volume surge
- Orange: General volume surge
- Lime/Magenta: Confirmed breakout signals
- Directional Arrows: Clear bullish (up) and bearish (down) breakout signals
- Background Highlighting: Highlights high-volume periods for easy identification
- Reference Lines: Shows volume surge thresholds and average volume levels
How It Works
Volume Pattern Recognition
The indicator analyzes three critical volume components:
- Current vs. Historical Volume: Determines if current volume is significantly above normal
- Volume Trend Direction: Identifies whether volume is increasing or decreasing over time
- Volume Distribution: Analyzes where volume occurs within each price bar
Signal Generation Process
- Volume Surge Detection: Identifies when volume exceeds your threshold (default 1.5x average)
- Trend Analysis: Confirms volume is increasing over your specified period (default 20 bars)
- Price Confirmation: Validates that price is actually breaking out of recent ranges
- Pattern Confirmation: Ensures accumulation/distribution supports the directional bias
Breakout Confirmation
- Bullish Signals: Require volume surge + upward price breakout + accumulation pattern
- Bearish Signals: Require volume surge + downward price breakdown + distribution pattern
- Strength Filtering: Only signals when volume increase exceeds your minimum threshold (default 50%)
Customizable Parameters
Volume Analysis Settings
- Volume Trend Length (20): Period for calculating volume trends
- Relative Volume Period (50): Lookback period for average volume calculation
- Volume Surge Threshold (1.5): Minimum relative volume for surge detection
- Minimum Volume Increase (50%): Required volume increase percentage for signals
Breakout Detection Settings
- Price Breakout Period (20): Lookback period for identifying price breakouts
- Signal Sensitivity: Adjustable thresholds for different trading styles
- Alert Conditions: Customizable audio and visual alerts
Display Options
- Volume Bar Display: Show/hide volume histogram
- Signal Arrows: Enable/disable breakout arrows
- Background Highlighting: Show/hide volume surge backgrounds
- Information Labels: Display real-time statistics and conditions
Trading Applications
Swing Trading
- Entry Timing: Enter positions when volume confirms breakout direction
- Risk Management: Use volume patterns to gauge conviction behind moves
- Position Sizing: Increase size on high-conviction volume breakouts
Day Trading
- Intraday Breakouts: Identify high-probability intraday breakout opportunities
- Volume Climax: Spot potential reversal points after volume exhaustion
- Momentum Trading: Ride volume-confirmed momentum moves
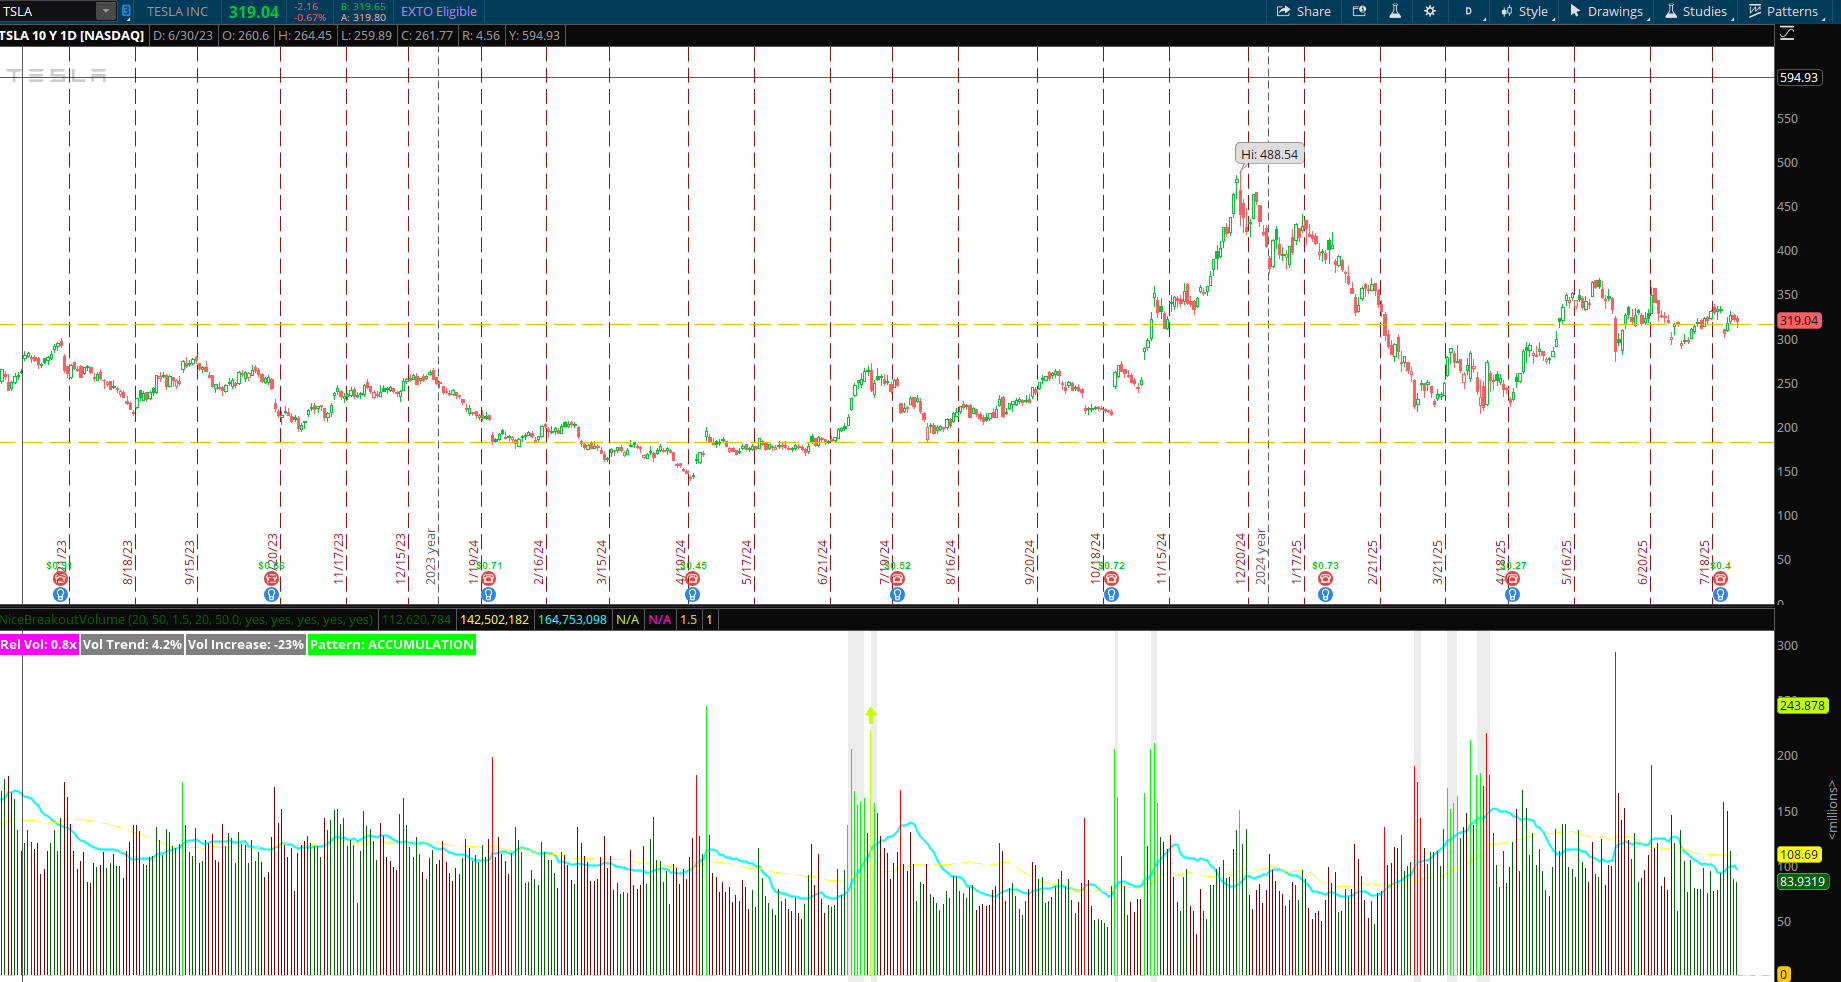
Position Trading
- Accumulation Phases: Identify long-term accumulation for position entries
- Distribution Warnings: Detect institutional selling before major declines
- Trend Confirmation: Use volume to confirm major trend changes
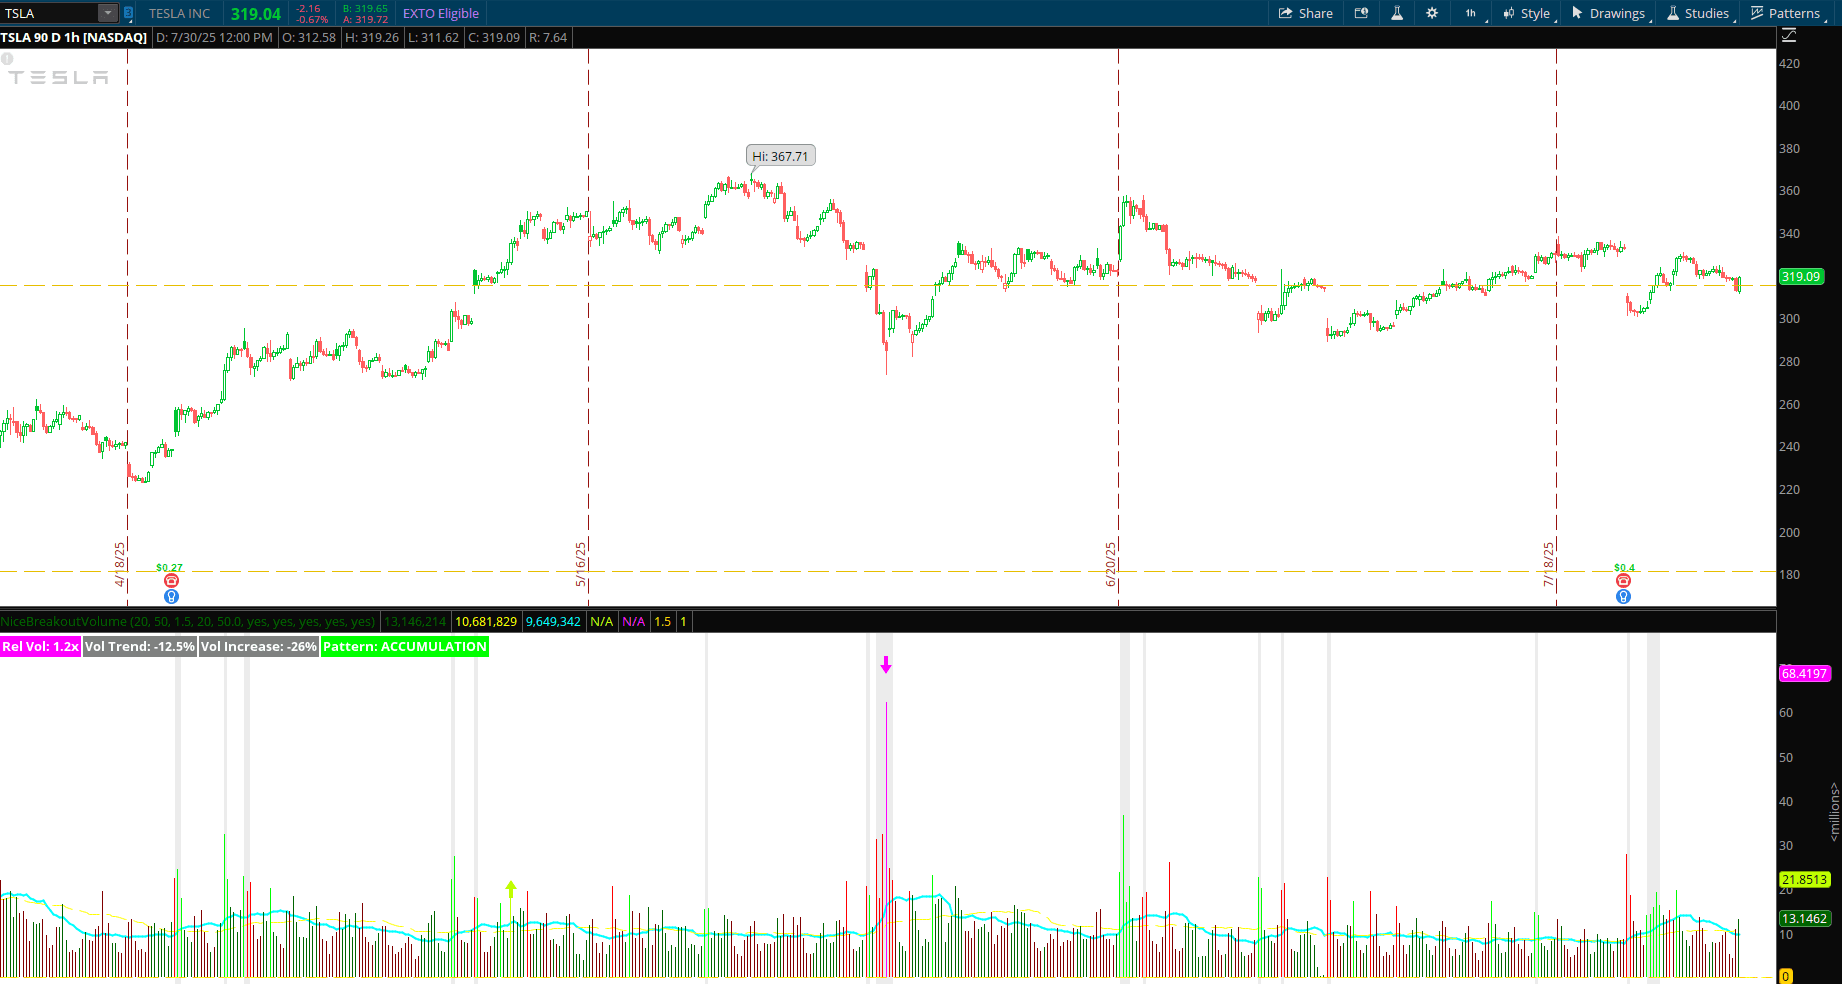
Real-Time Information Display
The indicator provides continuous feedback through:
- Relative Volume Ratio: Shows current volume as multiple of average (e.g., "2.3x")
- Volume Trend Percentage: Displays volume trend direction and strength
- Pattern Identification: Labels current accumulation/distribution phase
- Signal Status: Real-time alerts for breakout conditions
Advanced Features
Alert System
- Customizable Alerts: Audio and visual notifications for breakout signals
- Real-Time Monitoring: Continuous scanning for volume surge conditions
- Multiple Alert Types: Different sounds for bullish vs. bearish signals
Performance Optimization
- Efficient Calculations: Optimized for real-time performance
- Memory Management: Handles large datasets without lag
- Customizable Display: Hide unused features to improve chart clarity
Why This Indicator is Different
Unlike simple volume indicators that only show current volume levels, the Volume Breakout Detector:
- Predicts Movement: Identifies volume building BEFORE major price moves
- Filters Noise: Advanced algorithms reduce false signals
- Combines Multiple Factors: Uses volume, price action, and accumulation/distribution together
- Provides Context: Shows not just what's happening, but what it means for price direction
Installation and Setup
- Import the ThinkScript code into ThinkOrSwim
- Apply to your chart as a lower study
- Customize parameters based on your trading timeframe and style
- Set Alerts for automated breakout notifications
- Practice identifying patterns in historical data before live trading
Best Practices for Use
- Combine with Price Action: Use volume signals to confirm price-based setups
- Adjust for Market Conditions: Modify thresholds during high/low volatility periods
- Multiple Timeframe Analysis: Check volume patterns on different timeframes
- Risk Management: Always use proper position sizing regardless of signal strength
This indicator transforms volume analysis from a simple measurement into a sophisticated breakout prediction system, giving traders a significant advantage in identifying high-probability trading opportunities before they become obvious to the market.
Note: This indicator code is provided free for educational purposes. Test thoroughly before using in live trading.
Legal Disclaimer & Risk Warning
Educational Purpose: This code is provided for educational and informational purposes only. It does not constitute financial, investment, or trading advice.
No Performance Guarantee: Past performance is not indicative of future results. Trading involves substantial risk, including potential loss of capital.
Test Thoroughly: Always test indicators in a paper trading environment before using real money. Verify compatibility with your platform version.
Use at Your Own Risk: You are solely responsible for your trading decisions. We are not liable for any losses resulting from use of this code.
Attribution: If you share or modify this code, please maintain proper attribution to the original author.
By using this code, you acknowledge understanding and acceptance of these terms.