
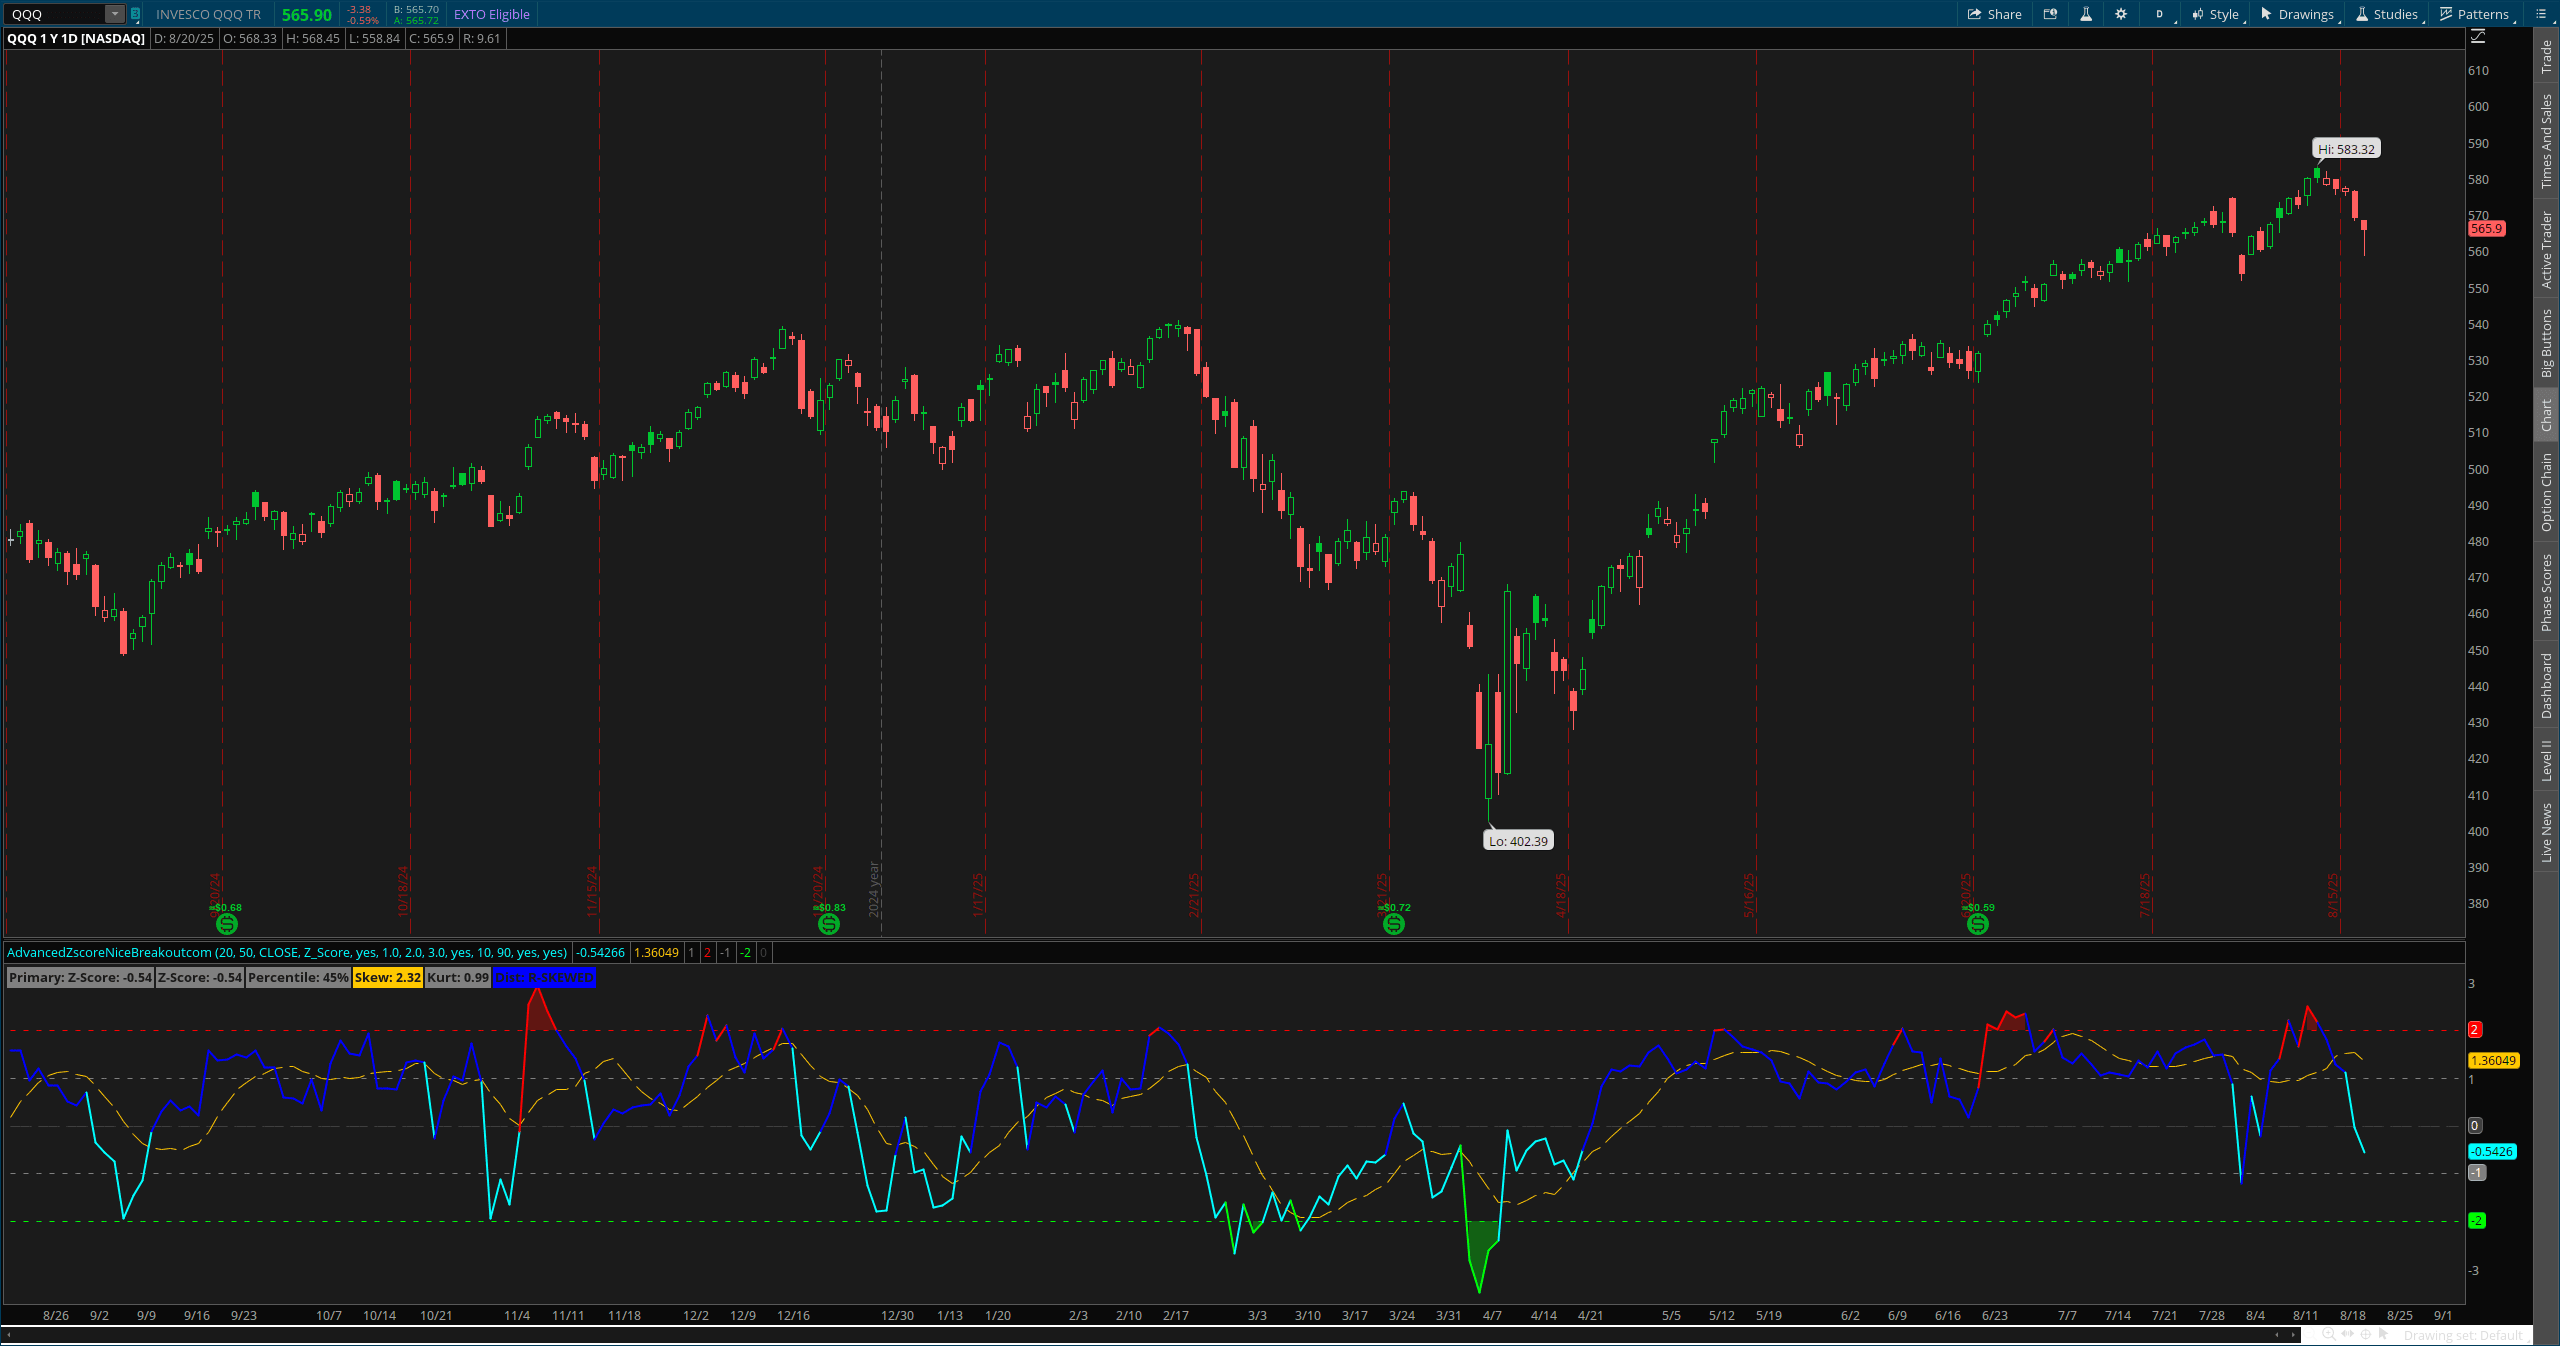
Advanced Zscore Pro
This Thinkorswim indicator is perfect for quantitative traders who want to apply statistical analysis to their trading decisions Z-score
Indicator Code
thinkscript# Advanced Statistical Studies Indicator
#
# DESCRIPTION:
# This comprehensive statistical analysis indicator provides multiple statistical measures
# to evaluate price behavior, probability distributions, and market anomalies. It combines
# Z-scores, percentile rankings, skewness, kurtosis, and probability bands to give traders
# a complete statistical view of market conditions.
#
# FEATURES:
# - Z-Score analysis with multiple lookback periods
# - Percentile ranking system for relative positioning
# - Skewness measurement for distribution asymmetry
# - Kurtosis analysis for tail risk assessment
# - Standard deviation bands and probability zones
# - Mean reversion signals and statistical extremes
# - Customizable statistical parameters and display options
#
# USAGE:
# - Identify statistically extreme price levels for mean reversion trades
# - Assess probability of continued moves vs. reversals
# - Evaluate distribution characteristics for better risk assessment
# - Use statistical extremes for entry/exit timing
# - Monitor market regime changes through statistical shifts
#
# PARAMETERS:
# - Primary Length: Main lookback period for calculations (default: 20)
# - Long Length: Extended period for trend analysis (default: 50)
# - Statistical Method: Choose primary statistical focus
# - Probability Bands: Standard deviation multiples for probability zones
#
# Author: MarketEdgePro
# Version: 1.0
declare lower;
# Input parameters
input primaryLength = 20;
input longLength = 50;
input priceSource = close;
input statisticalMethod = {default "Z_Score", "Percentile_Rank", "Skewness", "Kurtosis", "Composite"};
input showProbabilityBands = yes;
input stdDev1 = 1.0;
input stdDev2 = 2.0;
input stdDev3 = 3.0;
input showMovingAverage = yes;
input maLength = 10;
input extremeThreshold = 90;
input showLabels = yes;
input showBackground = yes;
# Basic statistical calculations
def price = priceSource;
def mean = Average(price, primaryLength);
def longMean = Average(price, longLength);
def stdDeviation = StDev(price, primaryLength);
def variance = Power(stdDeviation, 2);
# Z-Score calculations (multiple timeframes)
def zScore = if stdDeviation != 0 then (price - mean) / stdDeviation else 0;
def longZScore = if StDev(price, longLength) != 0 then
(price - longMean) / StDev(price, longLength) else 0;
# Percentile rank calculation
def priceHigh = Highest(price, primaryLength);
def priceLow = Lowest(price, primaryLength);
def percentileRank = if (priceHigh != priceLow) then
100 * (price - priceLow) / (priceHigh - priceLow) else 50;
# Skewness calculation (asymmetry of distribution)
def deviation = price - mean;
def cubeDeviation = Power(deviation, 3);
def avgCubeDeviation = Average(cubeDeviation, primaryLength);
def skewness = if Power(stdDeviation, 3) != 0 then
avgCubeDeviation / Power(stdDeviation, 3) else 0;
# Kurtosis calculation (tail heaviness)
def fourthDeviation = Power(deviation, 4);
def avgFourthDeviation = Average(fourthDeviation, primaryLength);
def kurtosis = if Power(stdDeviation, 4) != 0 then
avgFourthDeviation / Power(stdDeviation, 4) - 3 else 0;
# Composite statistical score
def compositeScore = (zScore * 0.4) + ((percentileRank - 50) / 50 * 0.3) +
(skewness * 0.2) + (kurtosis * 0.1);
# Select primary display based on method
def primaryStat =
if statisticalMethod == statisticalMethod."Z_Score" then zScore
else if statisticalMethod == statisticalMethod."Percentile_Rank" then percentileRank
else if statisticalMethod == statisticalMethod."Skewness" then skewness * 10
else if statisticalMethod == statisticalMethod."Kurtosis" then kurtosis * 5
else if statisticalMethod == statisticalMethod."Composite" then compositeScore
else zScore;
# Moving average of primary statistic
def statMA = Average(primaryStat, maLength);
# Probability bands (for Z-Score method)
def upperBand1 = if statisticalMethod == statisticalMethod."Z_Score" then stdDev1 else 75;
def upperBand2 = if statisticalMethod == statisticalMethod."Z_Score" then stdDev2 else 90;
def upperBand3 = if statisticalMethod == statisticalMethod."Z_Score" then stdDev3 else 95;
def lowerBand1 = if statisticalMethod == statisticalMethod."Z_Score" then -stdDev1 else 25;
def lowerBand2 = if statisticalMethod == statisticalMethod."Z_Score" then -stdDev2 else 10;
def lowerBand3 = if statisticalMethod == statisticalMethod."Z_Score" then -stdDev3 else 5;
# Statistical extremes detection
def upperExtreme =
if statisticalMethod == statisticalMethod."Percentile_Rank" then
percentileRank > extremeThreshold
else primaryStat > upperBand2;
def lowerExtreme =
if statisticalMethod == statisticalMethod."Percentile_Rank" then
percentileRank < (100 - extremeThreshold)
else primaryStat < lowerBand2;
# Plot primary statistical measure
plot PrimaryStatLine = primaryStat;
PrimaryStatLine.SetDefaultColor(Color.BLUE);
PrimaryStatLine.SetLineWeight(2);
# Plot moving average
plot StatMovingAvg = if showMovingAverage then statMA else Double.NaN;
StatMovingAvg.SetDefaultColor(Color.ORANGE);
StatMovingAvg.SetStyle(Curve.LONG_DASH);
# Plot probability bands
plot UpperBand1Line = if showProbabilityBands then upperBand1 else Double.NaN;
UpperBand1Line.SetDefaultColor(Color.GRAY);
UpperBand1Line.SetStyle(Curve.SHORT_DASH);
plot UpperBand2Line = if showProbabilityBands then upperBand2 else Double.NaN;
UpperBand2Line.SetDefaultColor(Color.RED);
UpperBand2Line.SetStyle(Curve.SHORT_DASH);
plot LowerBand1Line = if showProbabilityBands then lowerBand1 else Double.NaN;
LowerBand1Line.SetDefaultColor(Color.GRAY);
LowerBand1Line.SetStyle(Curve.SHORT_DASH);
plot LowerBand2Line = if showProbabilityBands then lowerBand2 else Double.NaN;
LowerBand2Line.SetDefaultColor(Color.GREEN);
LowerBand2Line.SetStyle(Curve.SHORT_DASH);
# Zero/midpoint line
plot ZeroLine = if statisticalMethod == statisticalMethod."Z_Score" or
statisticalMethod == statisticalMethod."Composite" then 0
else if statisticalMethod == statisticalMethod."Percentile_Rank" then 50
else 0;
ZeroLine.SetDefaultColor(Color.DARK_GRAY);
ZeroLine.SetStyle(Curve.LONG_DASH);
# Color coding based on extremes
PrimaryStatLine.AssignValueColor(
if upperExtreme then Color.RED
else if lowerExtreme then Color.GREEN
else if primaryStat > 0 or (statisticalMethod == statisticalMethod."Percentile_Rank" and primaryStat > 50)
then Color.BLUE
else Color.CYAN
);
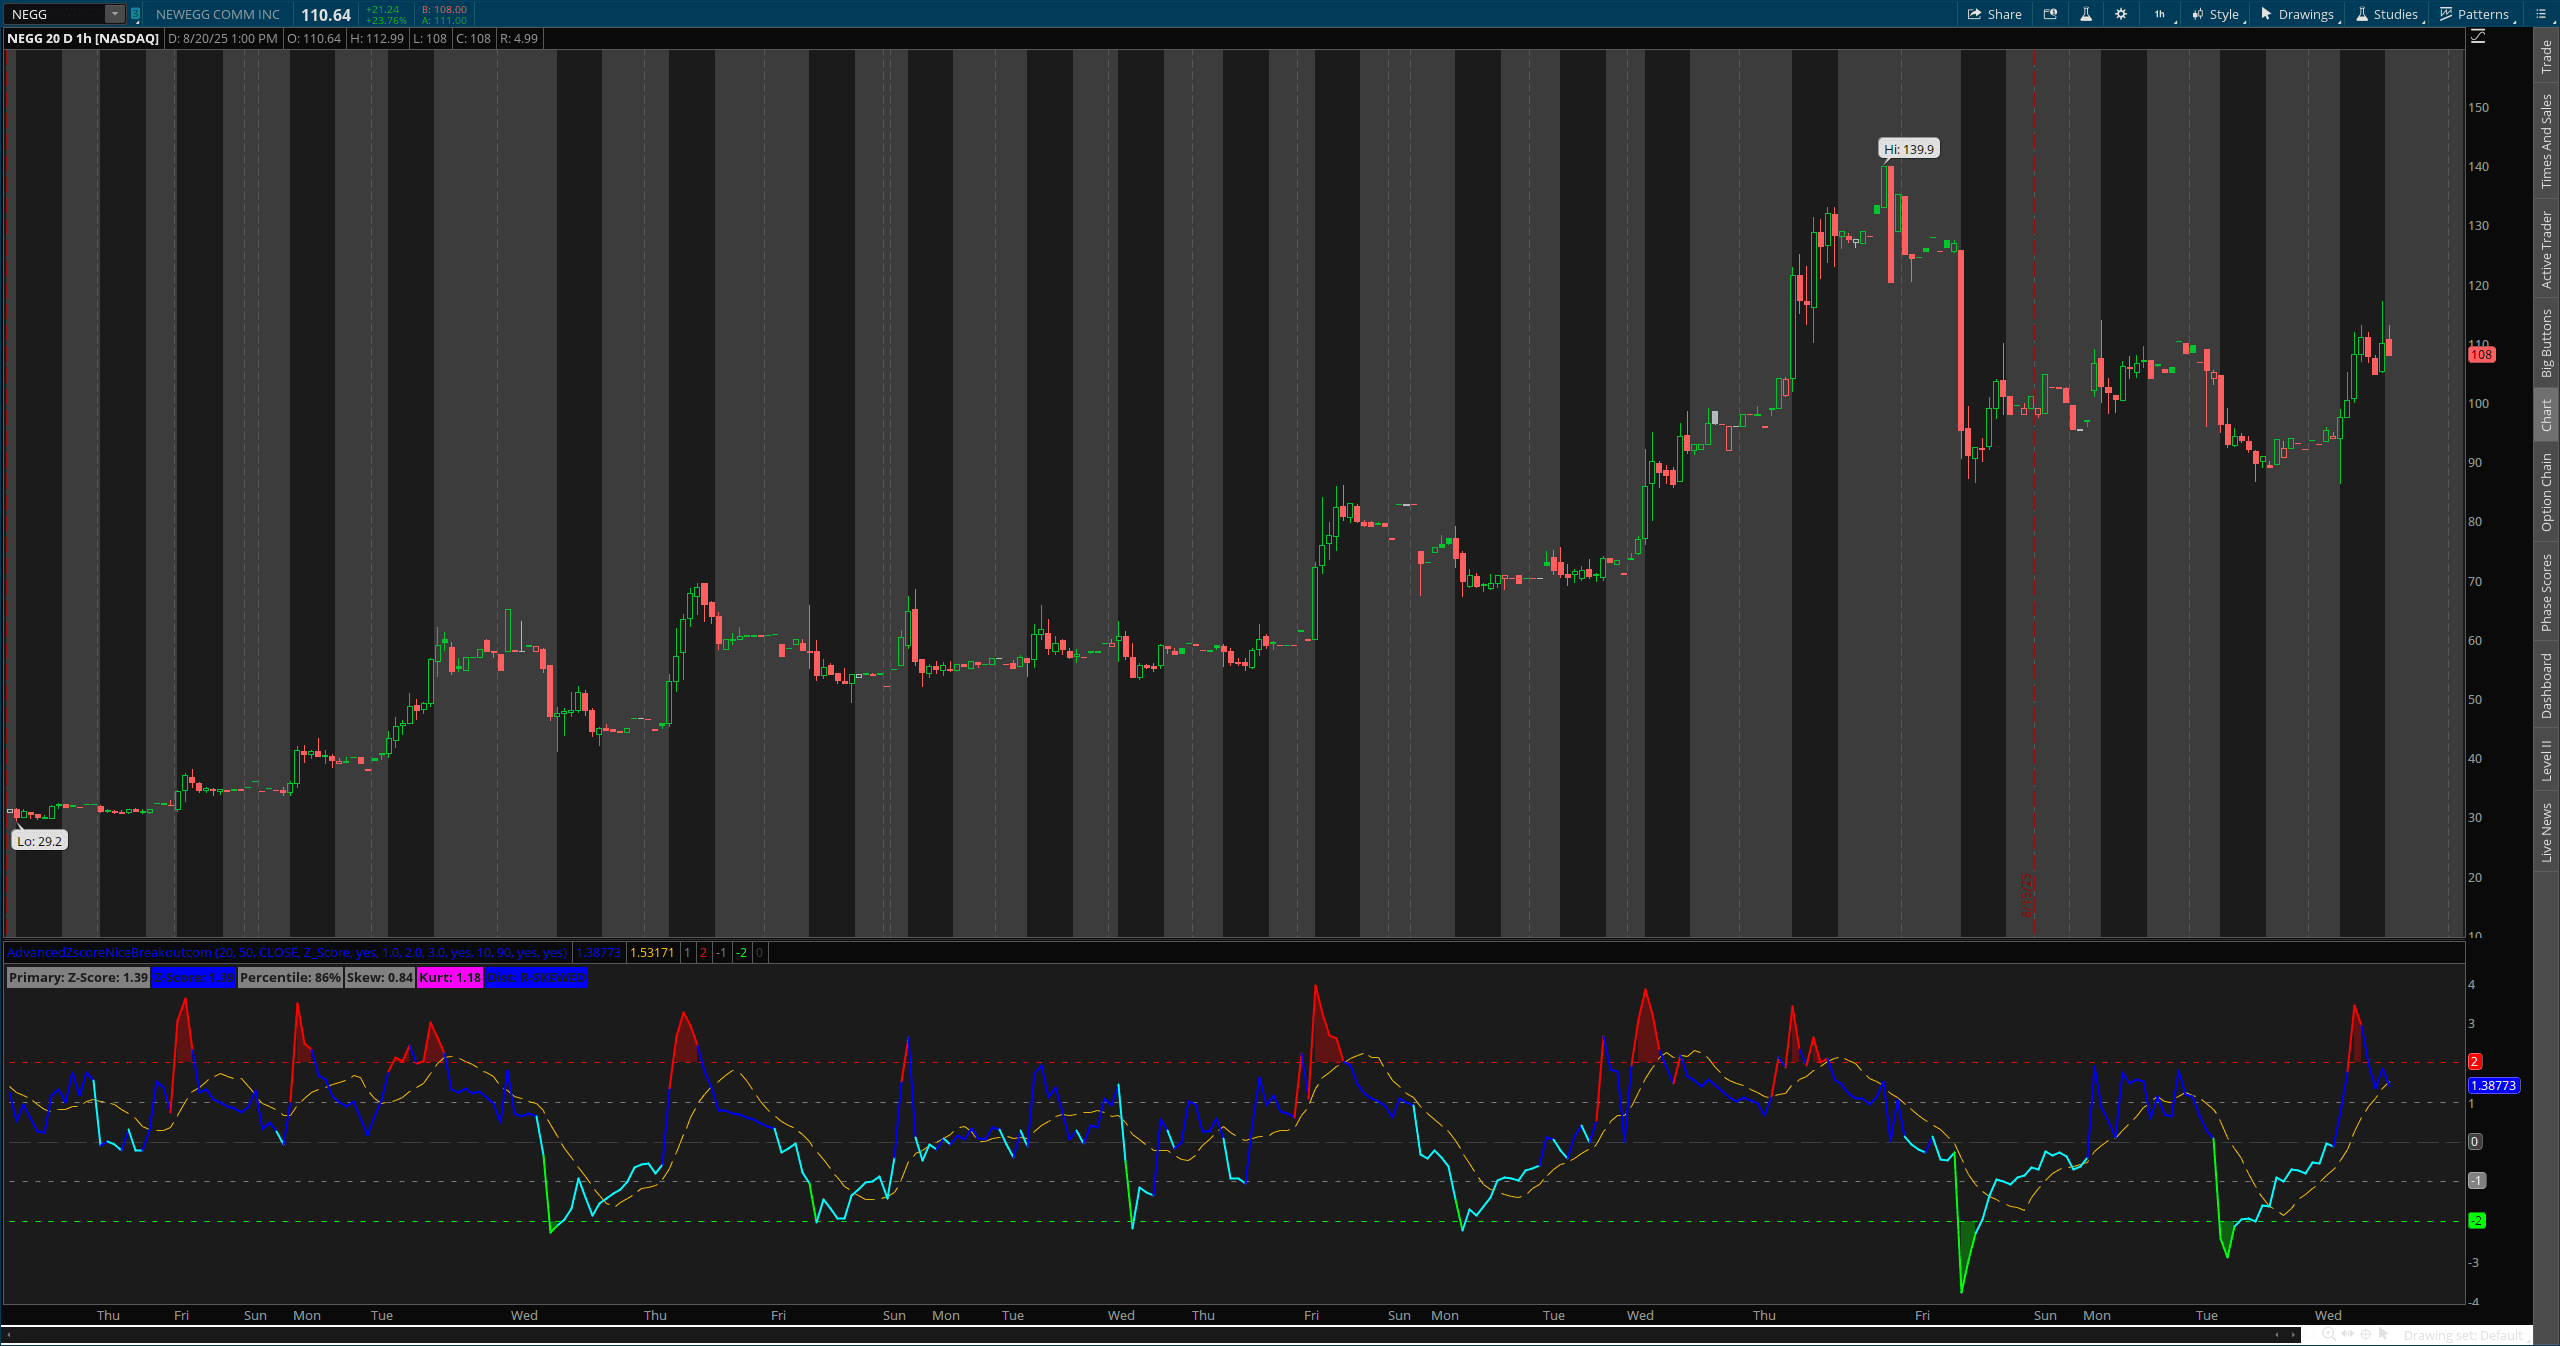
# Background shading for extreme zones
AddCloud(
if showBackground and upperExtreme then upperBand2 else Double.NaN,
if showBackground and upperExtreme then primaryStat else Double.NaN,
Color.RED,
Color.RED
);
AddCloud(
if showBackground and lowerExtreme then lowerBand2 else Double.NaN,
if showBackground and lowerExtreme then primaryStat else Double.NaN,
Color.GREEN,
Color.GREEN
);
# Statistical summary labels
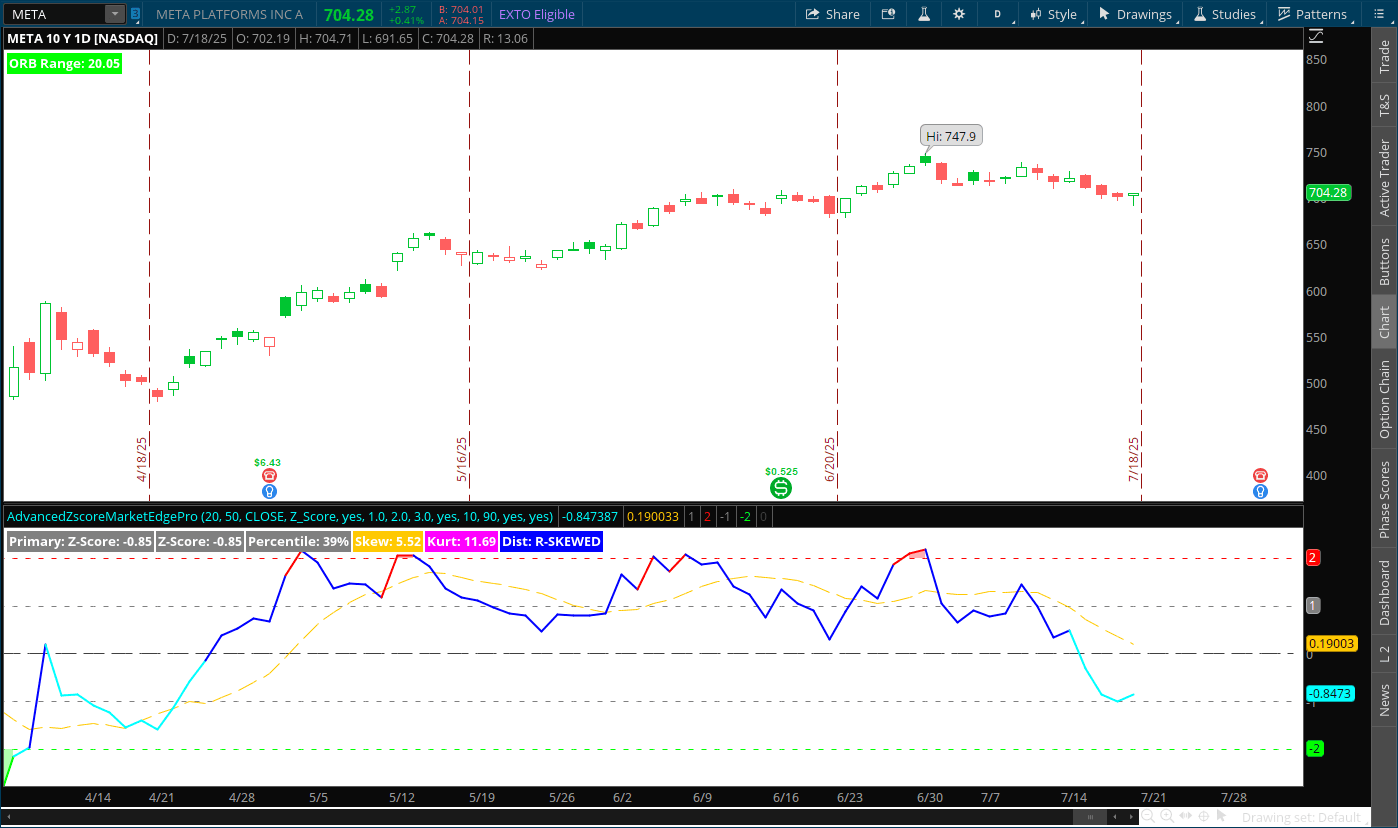
AddLabel(showLabels, "Primary: " +
(if statisticalMethod == statisticalMethod."Z_Score" then "Z-Score"
else if statisticalMethod == statisticalMethod."Percentile_Rank" then "Percentile"
else if statisticalMethod == statisticalMethod."Skewness" then "Skewness"
else if statisticalMethod == statisticalMethod."Kurtosis" then "Kurtosis"
else "Composite") + ": " + Round(primaryStat, 2), Color.Gray);
AddLabel(showLabels, "Z-Score: " + Round(zScore, 2),
if AbsValue(zScore) > 2 then Color.RED
else if AbsValue(zScore) > 1 then Color.BLUE
else Color.Gray);
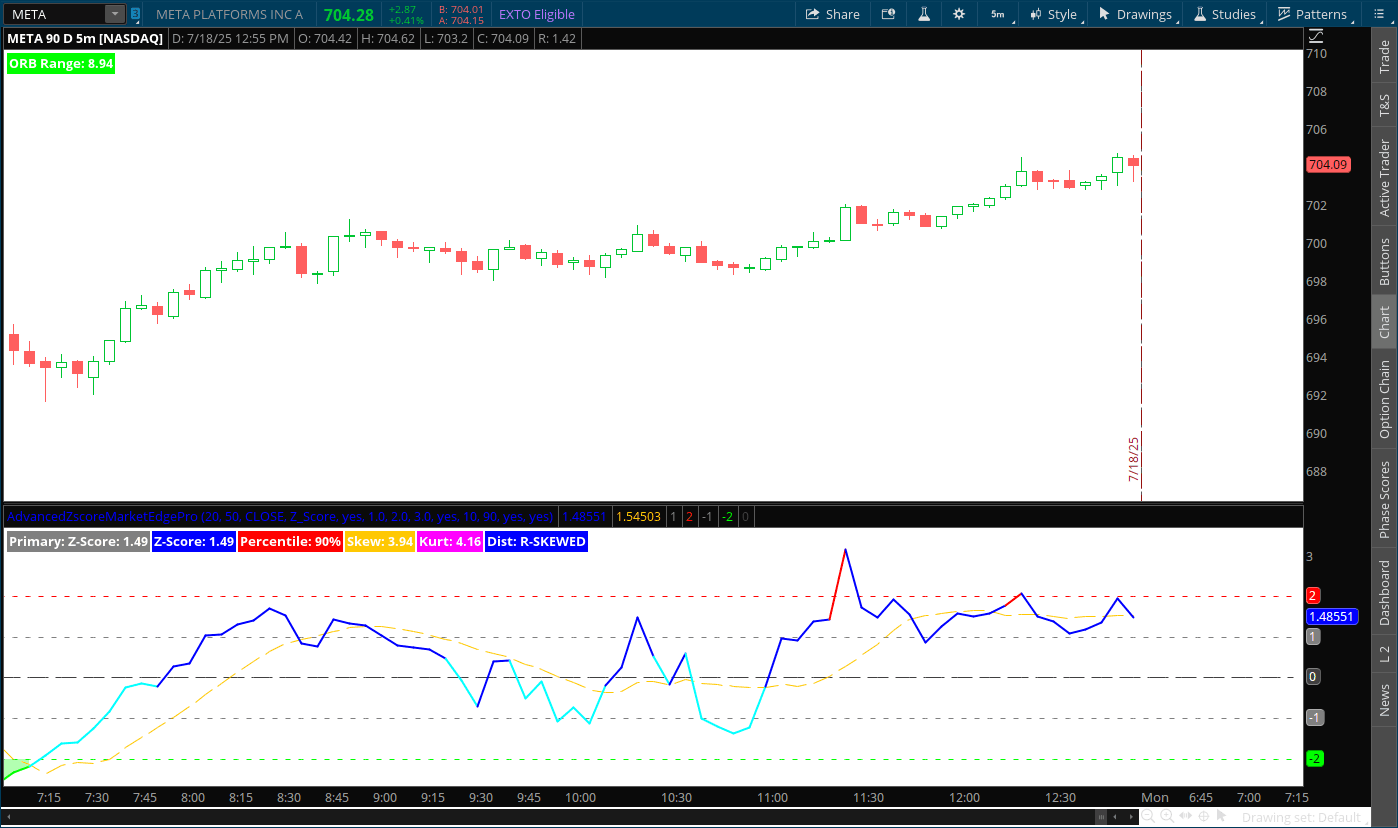
AddLabel(showLabels, "Percentile: " + Round(percentileRank, 0) + "%",
if percentileRank > 90 then Color.RED
else if percentileRank < 10 then Color.GREEN
else Color.Gray);
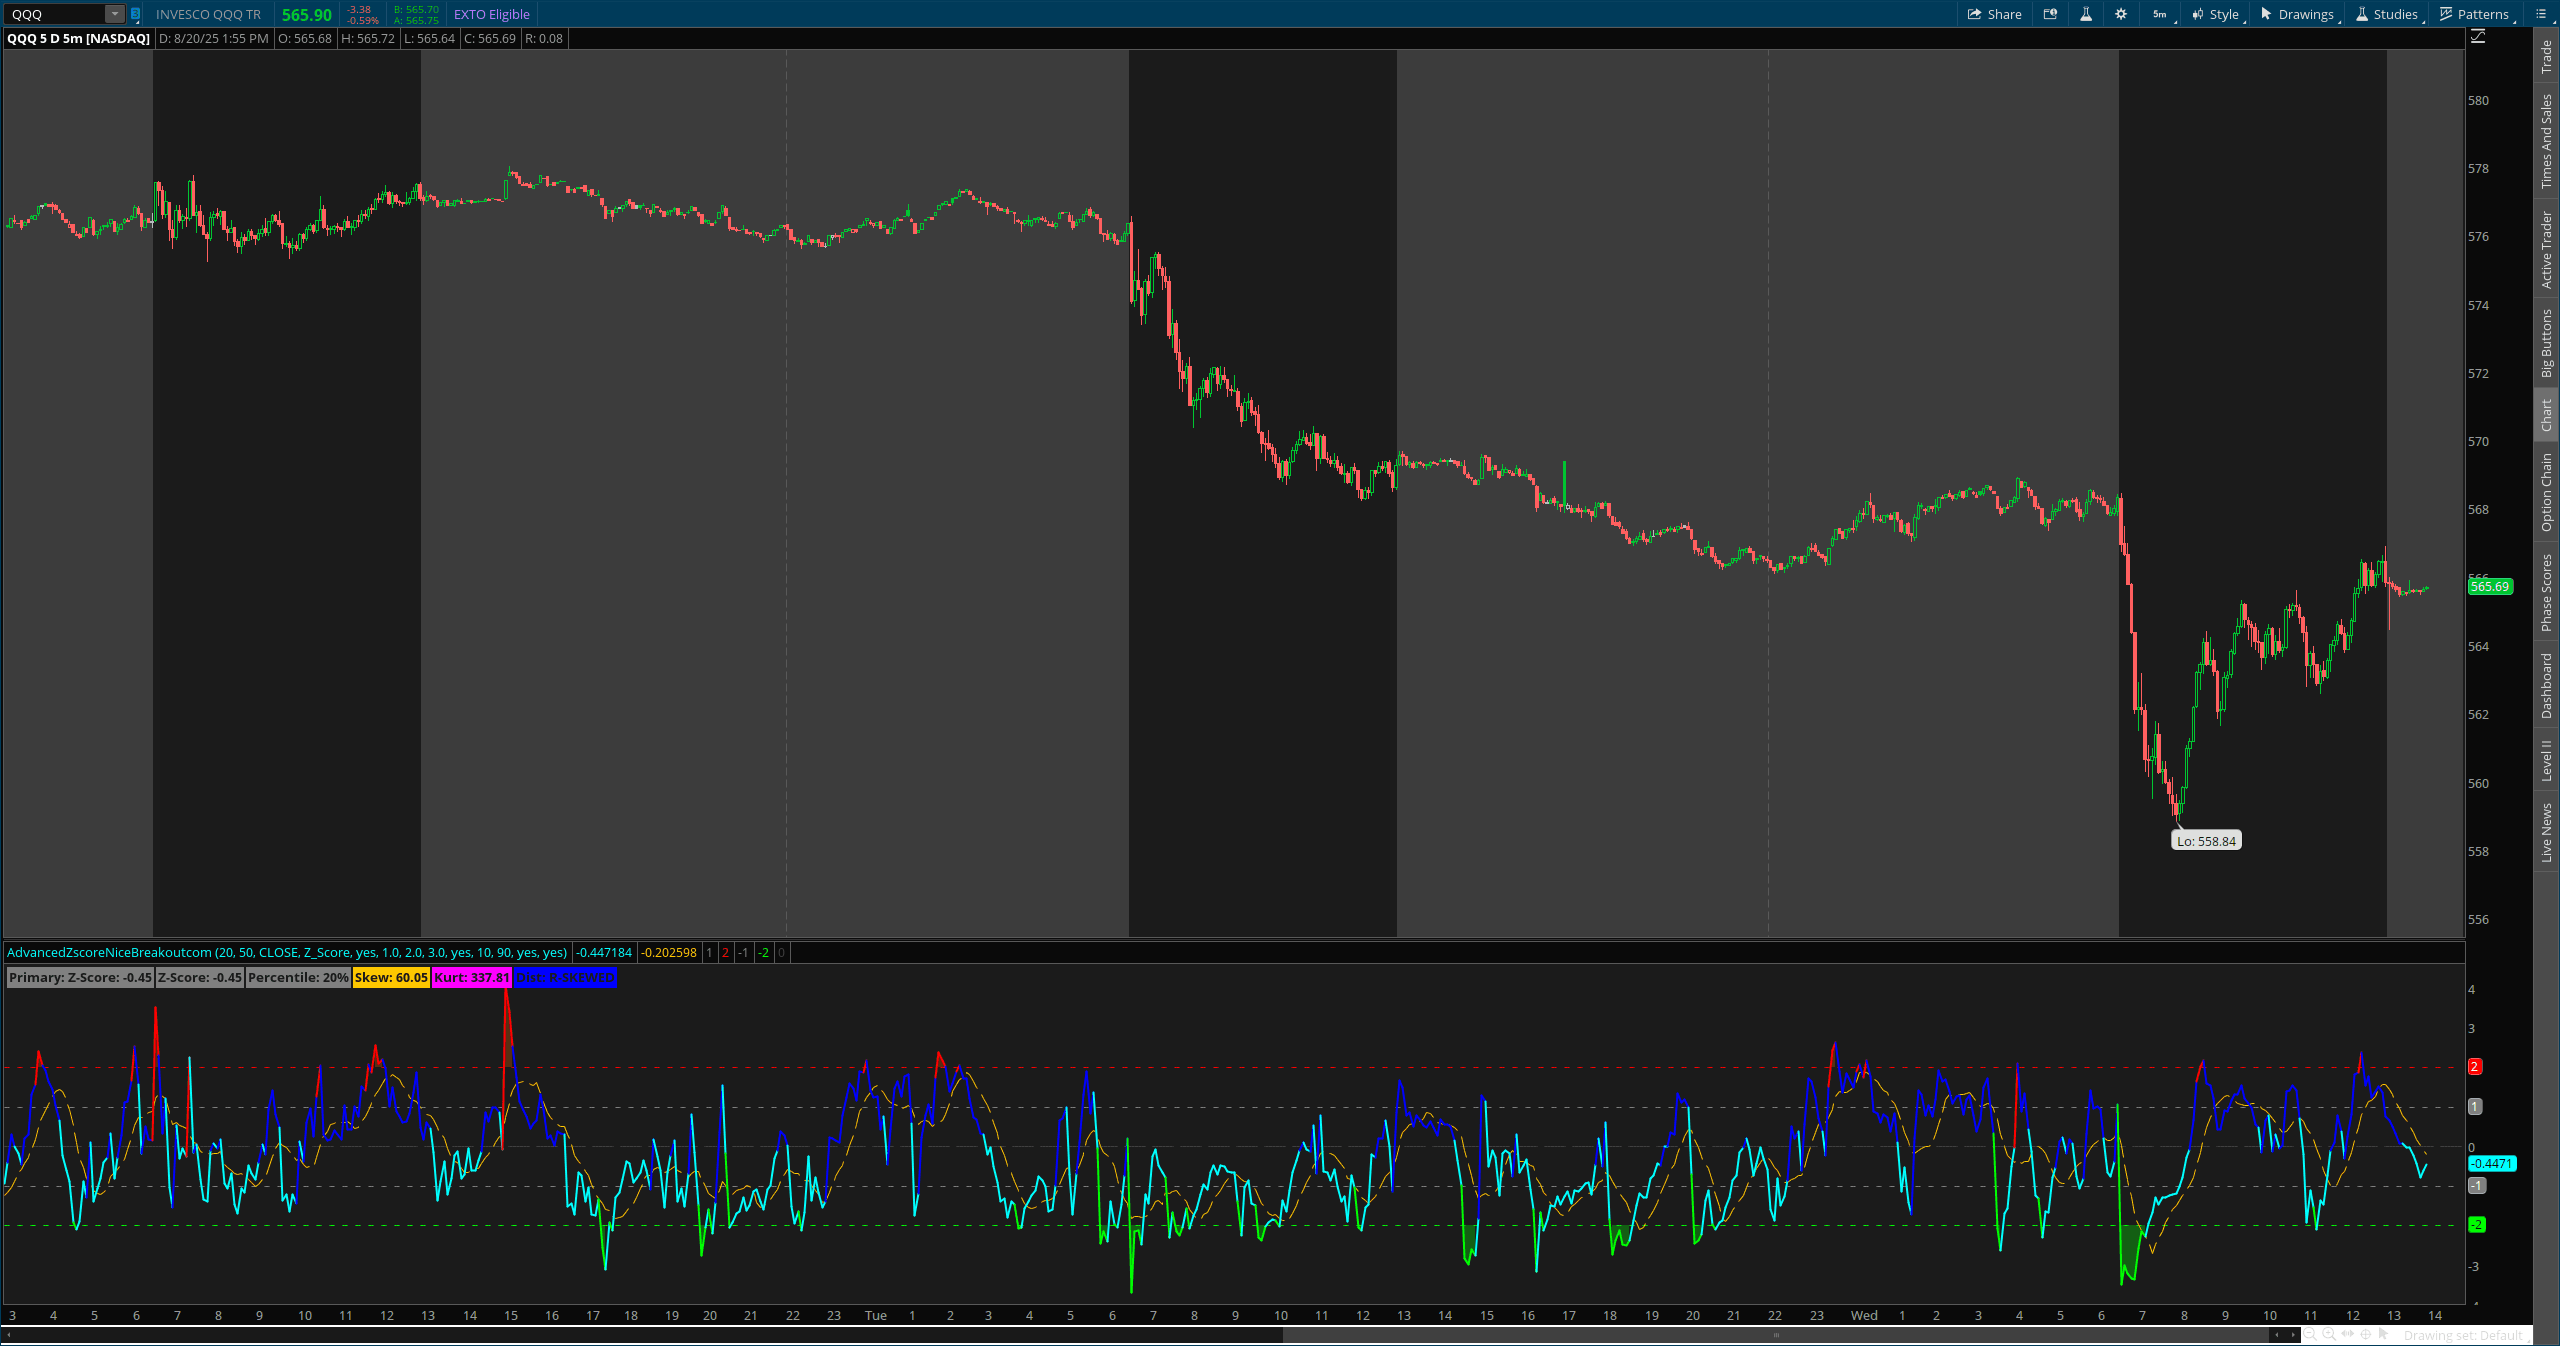
AddLabel(showLabels, "Skew: " + Round(skewness, 2),
if AbsValue(skewness) > 1 then Color.ORANGE else Color.gray);
AddLabel(showLabels, "Kurt: " + Round(kurtosis, 2),
if AbsValue(kurtosis) > 1 then Color.MAGENTA else Color.GRAY);
# Extreme condition alerts
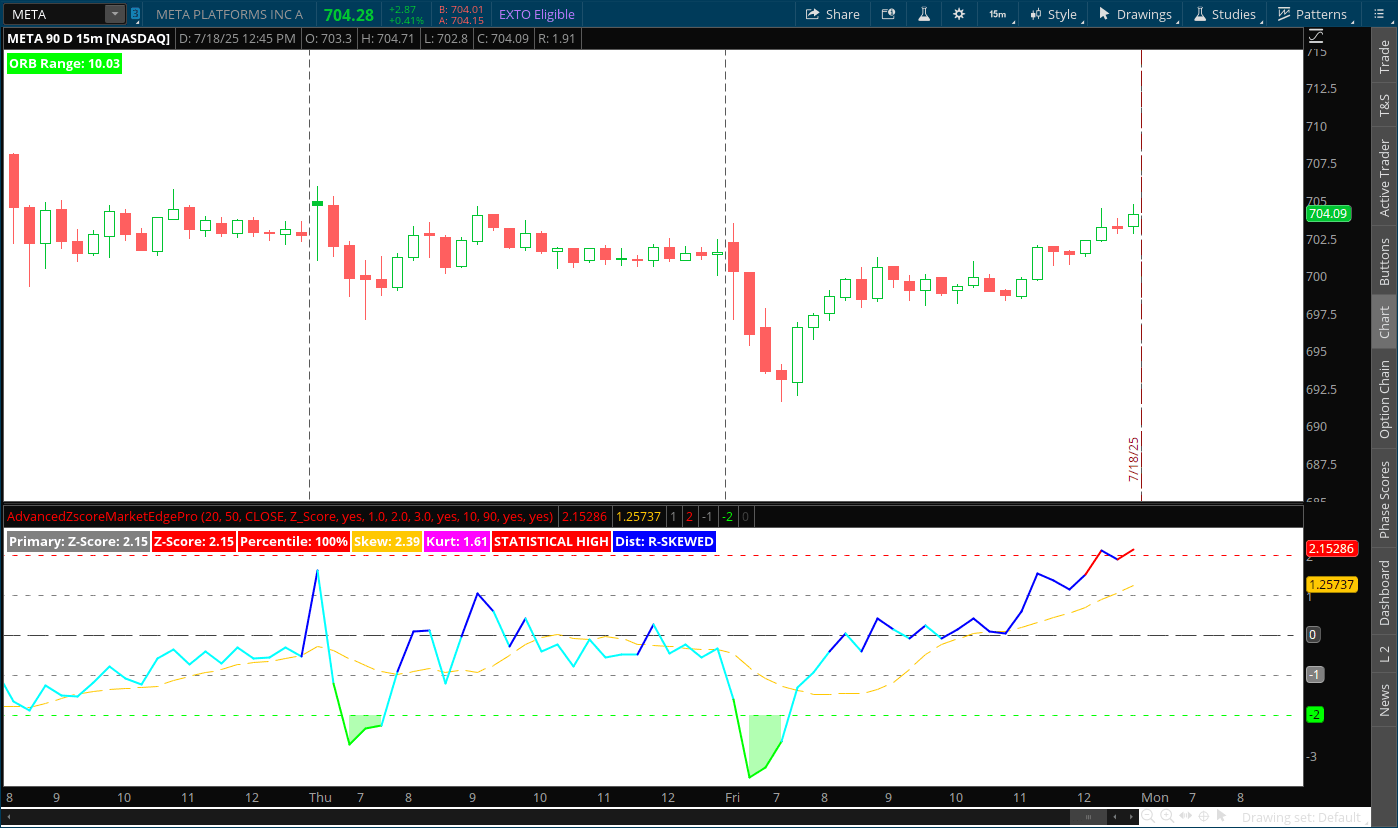
AddLabel(showLabels and upperExtreme, "STATISTICAL HIGH", Color.RED);
AddLabel(showLabels and lowerExtreme, "STATISTICAL LOW", Color.GREEN);
# Distribution analysis using numeric codes
def distributionCode =
if AbsValue(skewness) < 0.5 and AbsValue(kurtosis) < 1 then 1 # Normal
else if skewness > 0.5 then 2 # Right Skewed
else if skewness < -0.5 then 3 # Left Skewed
else if kurtosis > 1 then 4 # Heavy Tails
else if kurtosis < -1 then 5 # Light Tails
else 6; # Mixed
AddLabel(showLabels,
"Dist: " +
(if distributionCode == 1 then "NORMAL"
else if distributionCode == 2 then "R-SKEWED"
else if distributionCode == 3 then "L-SKEWED"
else if distributionCode == 4 then "HEAVY-TAIL"
else if distributionCode == 5 then "LIGHT-TAIL"
else "MIXED"),
if distributionCode == 1 then Color.Gray else Color.Blue);Original Author Credit
Created by: NiceBreakout
Website: https://www.Nicebreakout.com
Open ThinkorSwim and go to Charts > Studies (fx).
Click Edit Studies > then Create New Study.
Name your indicator (e.g., "My Custom Indicator").
Paste the ThinkScript code into the editor.
Click OK, then Apply to add it to your chart.
USAGE:
Identify statistically extreme price levels for mean reversion trades
Assess probability of continued moves vs. reversals
Evaluate distribution characteristics for better risk assessment
Use statistical extremes for entry/exit timing
Monitor market regime changes through statistical shifts
WATCH IT IN ACTION HERE: https://youtu.be/rqHcs80nDVs
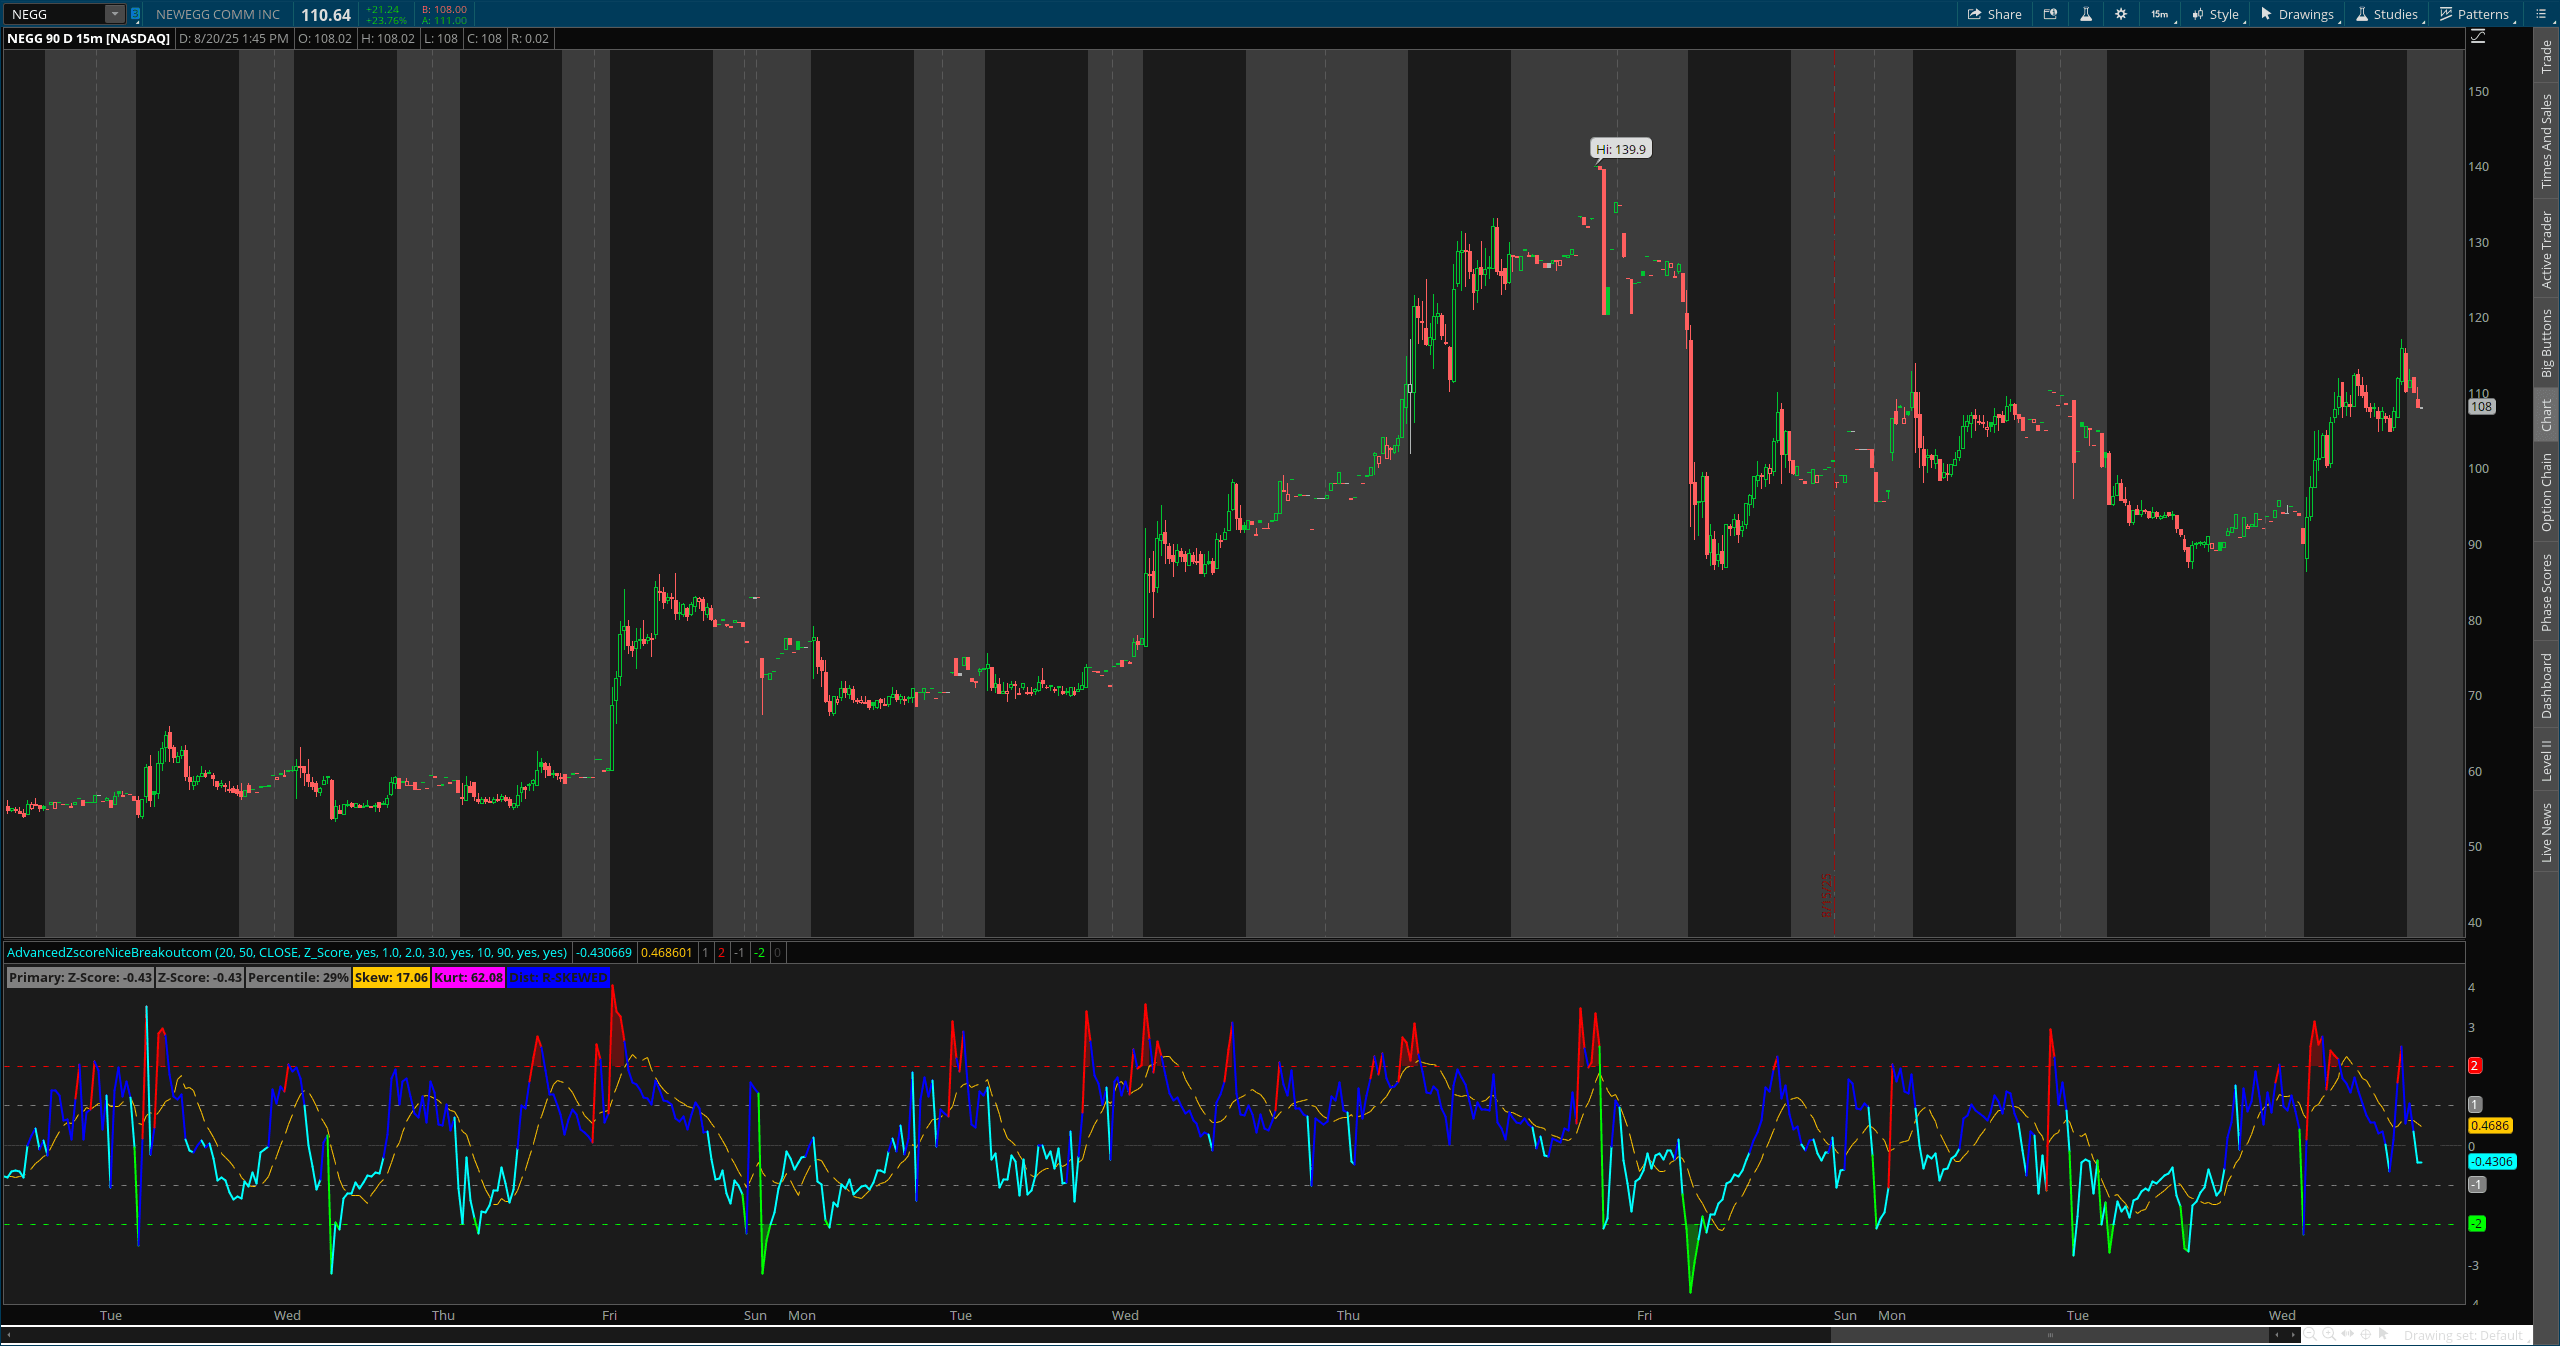
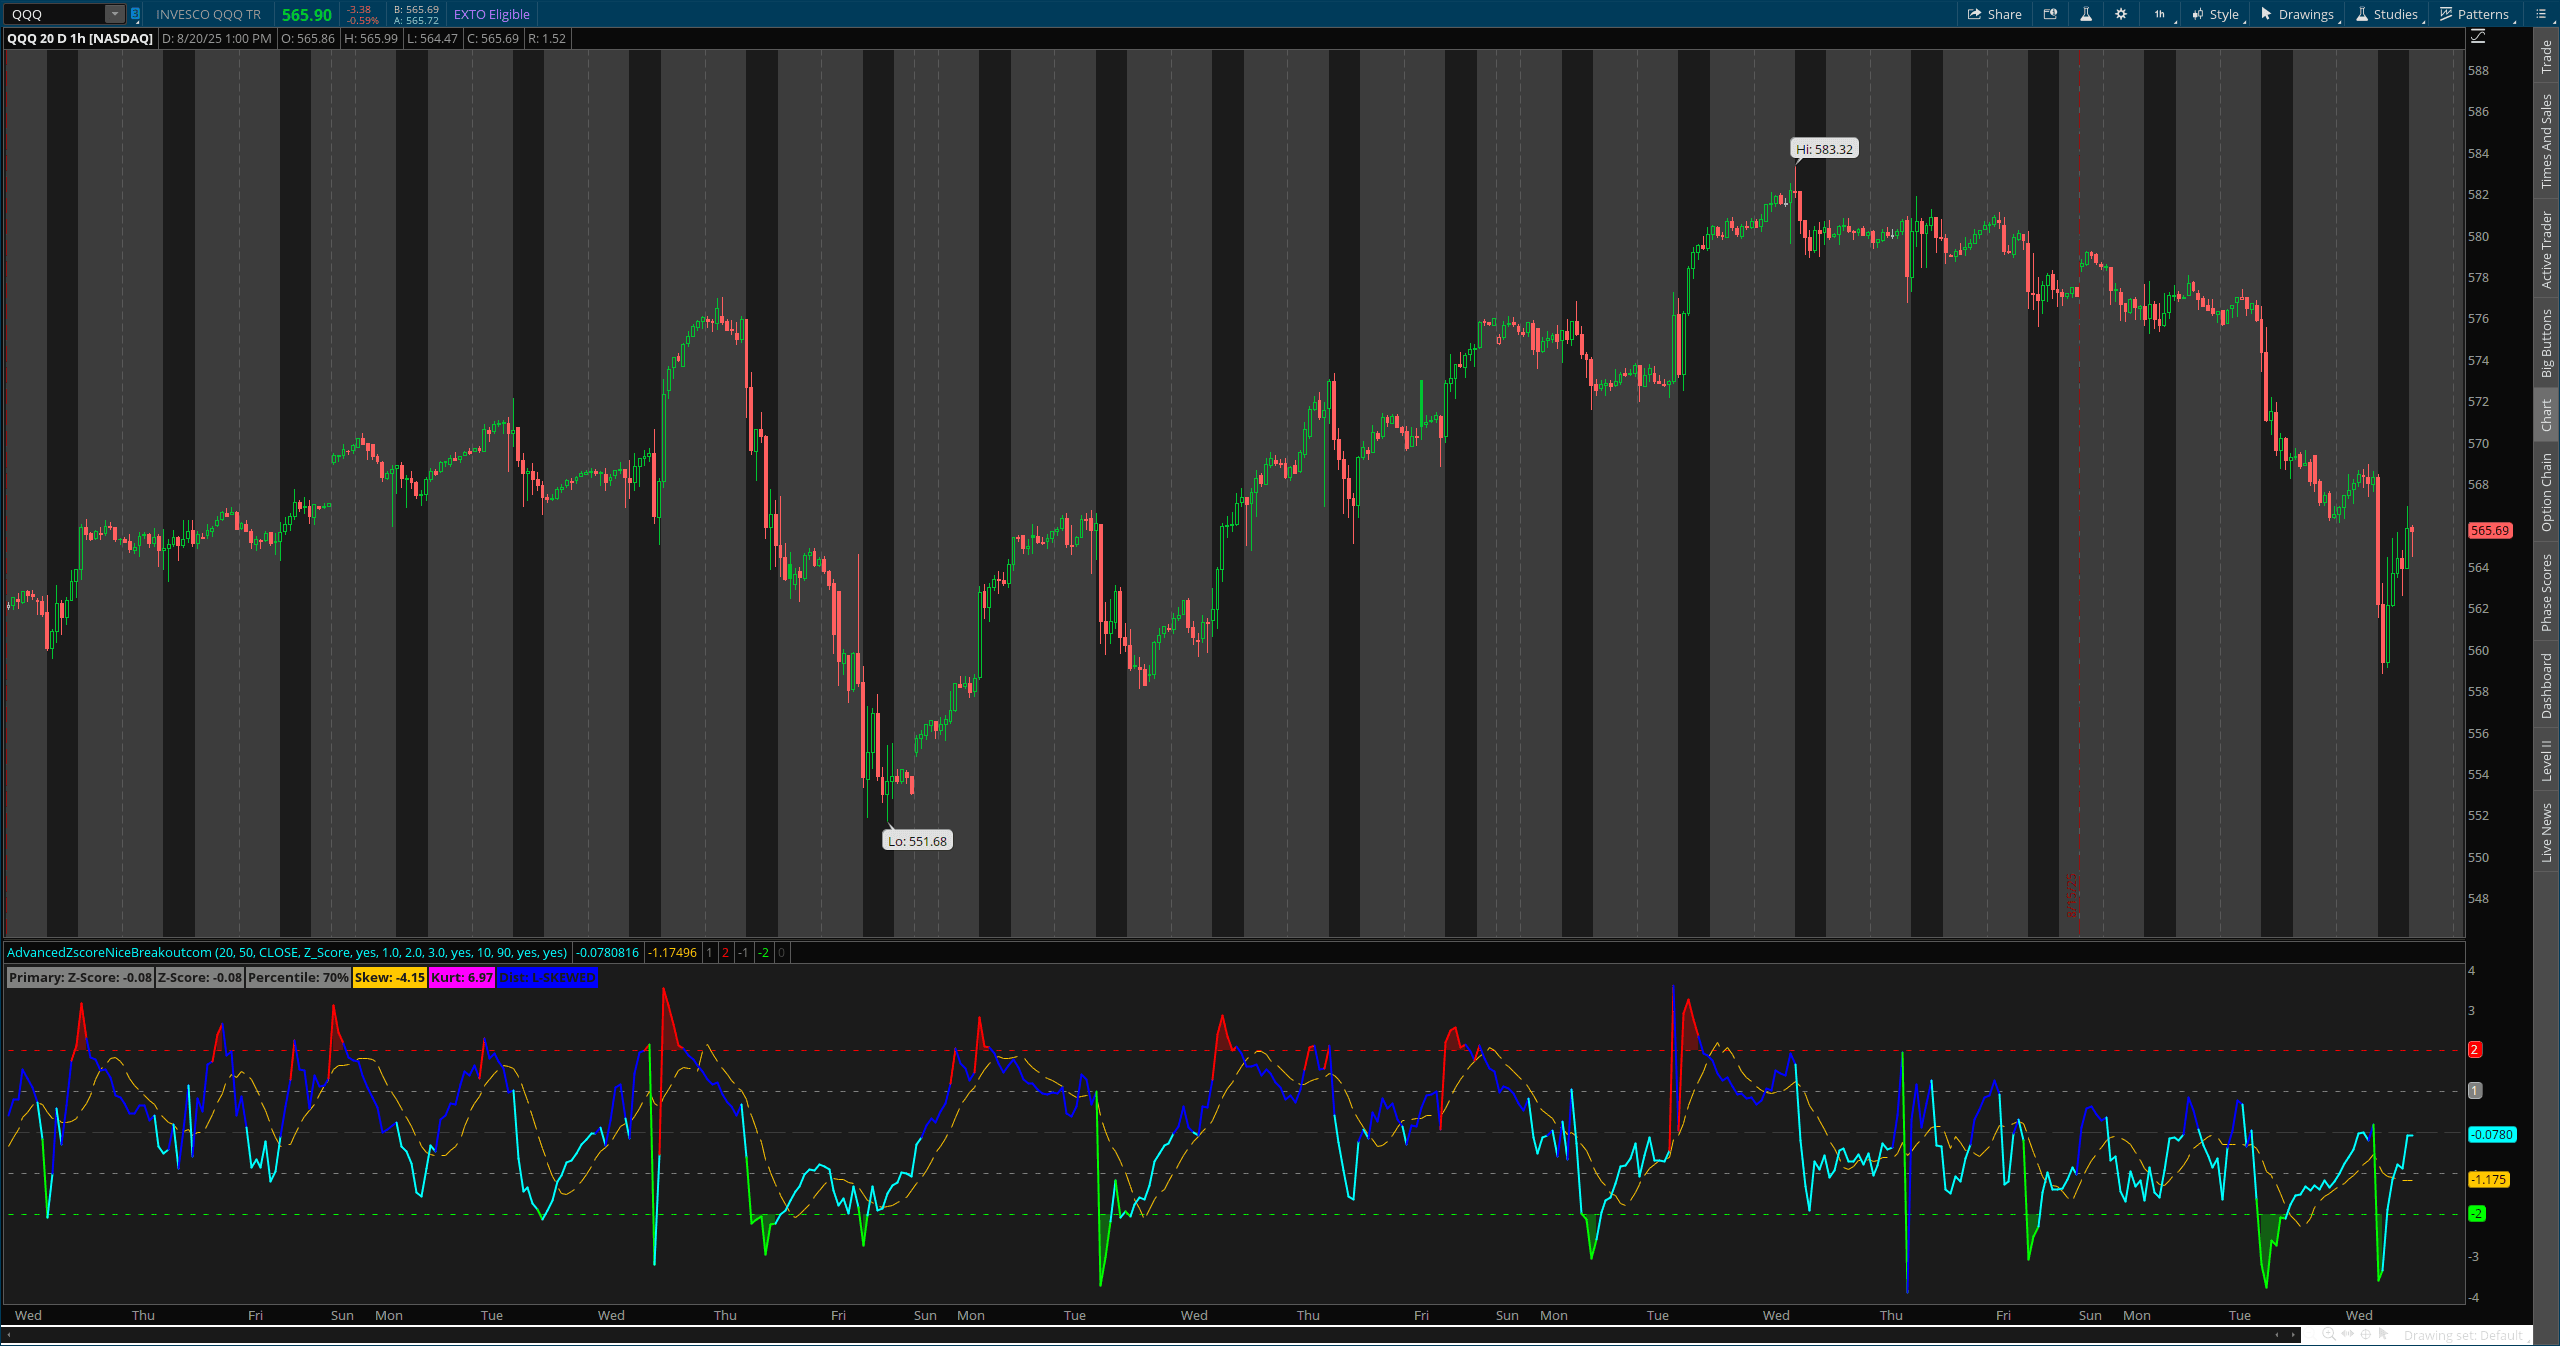
This indicator is perfect for quantitative traders who want to apply statistical analysis to their trading decisions. It works across all timeframes and provides objective, mathematical assessment of market conditions rather than subjective technical analysis.
Key Statistical Measures:
1. Z-Score Analysis
- Multiple timeframe Z-scores (short and long-term)
- Standard deviation bands (1σ, 2σ, 3σ)
- Statistical extreme identification
2. Percentile Ranking
- Shows where current price ranks vs. recent history (0-100%)
- Identifies statistical highs/lows
- Customizable extreme thresholds
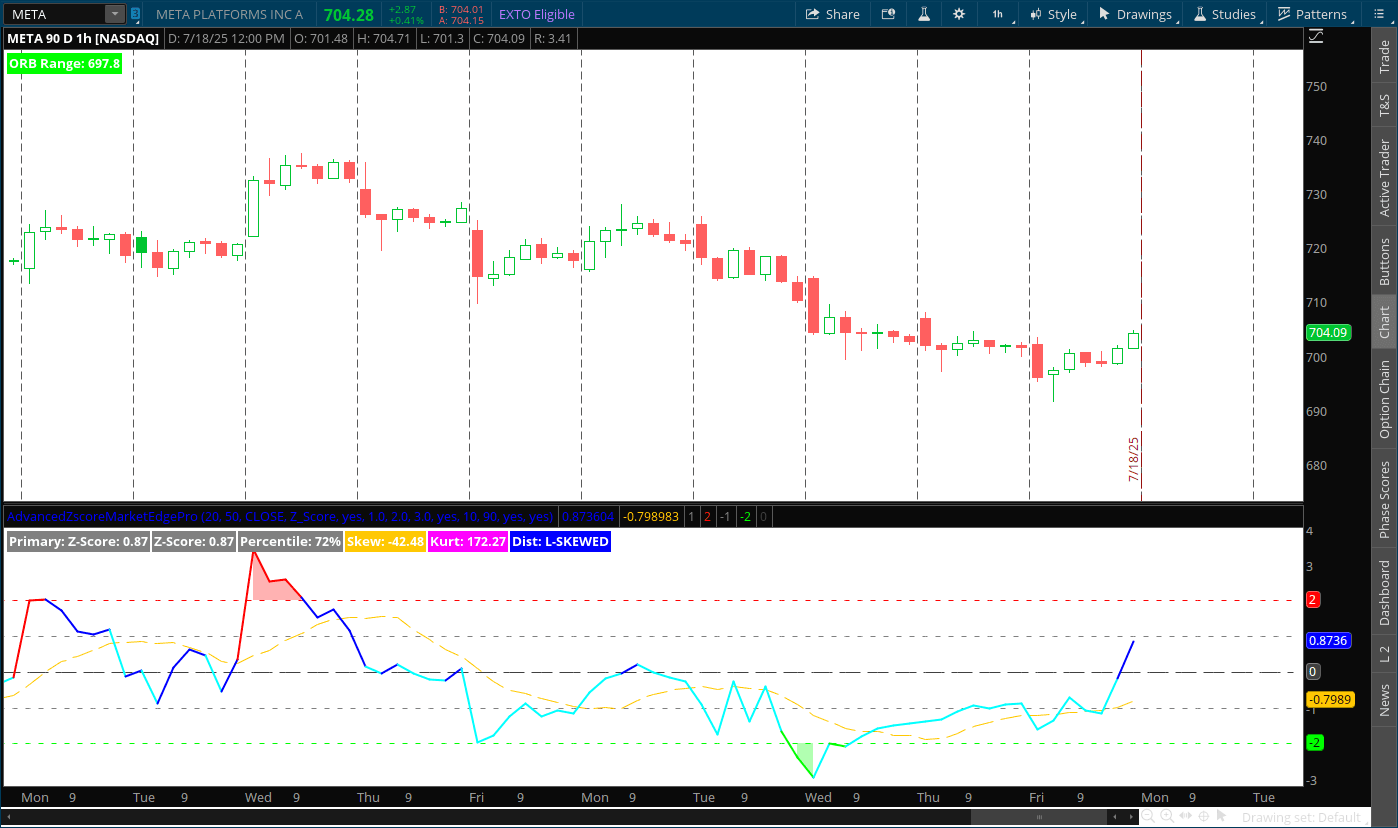
3. Skewness Measurement
- Measures distribution asymmetry
- Identifies right-skewed (bullish bias) vs left-skewed (bearish bias) periods
- Helps assess probability of directional moves
4. Kurtosis Analysis
- Measures "tail heaviness" of price distribution
- High kurtosis = more extreme moves likely
- Low kurtosis = more predictable, normal distribution
5. Composite Statistical Score
- Weighted combination of all measures
- Single value for overall statistical assessment
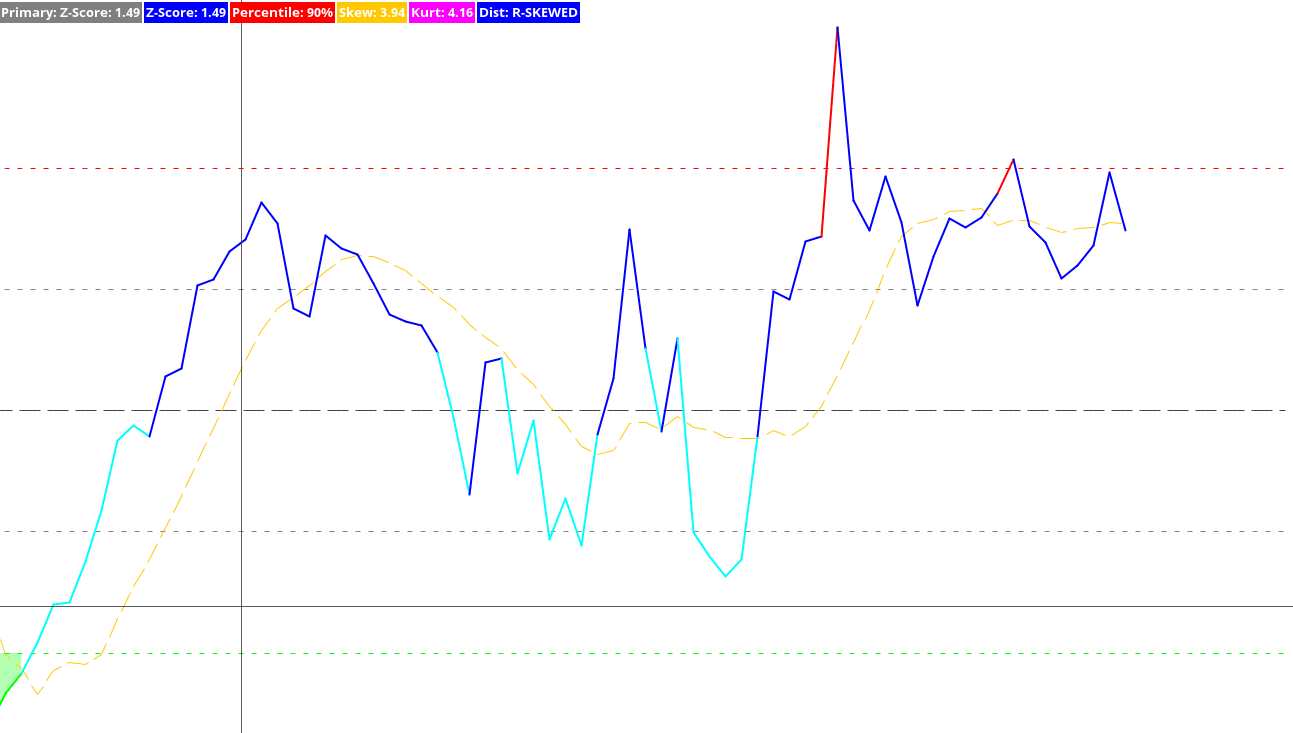
Visual Features:
- Color-coded lines based on statistical extremes
- Probability bands showing standard deviation levels
- Background shading for extreme zones
- Multiple display modes - choose your primary focus
- Comprehensive labels showing all key statistics
- Distribution classification (Normal, Skewed, Heavy Tails, etc.)
Trading Applications:
- Mean Reversion: Identify statistically extreme levels for reversal trades
- Probability Assessment: Gauge likelihood of continued moves vs. reversals
- Risk Management: Use statistical extremes for position sizing
- Market Regime Detection: Monitor changes in distribution characteristics
- Entry/Exit Timing: Use statistical signals for better trade timing
Key Alerts:
- STATISTICAL HIGH/LOW warnings for extreme readings
- Distribution type classification for market character assessment
- Color-coded values for quick visual assessment
Note: This indicator code is provided free for educational purposes. Test thoroughly before using in live trading.
Legal Disclaimer & Risk Warning
Educational Purpose: This code is provided for educational and informational purposes only. It does not constitute financial, investment, or trading advice.
No Performance Guarantee: Past performance is not indicative of future results. Trading involves substantial risk, including potential loss of capital.
Test Thoroughly: Always test indicators in a paper trading environment before using real money. Verify compatibility with your platform version.
Use at Your Own Risk: You are solely responsible for your trading decisions. We are not liable for any losses resulting from use of this code.
Attribution: If you share or modify this code, please maintain proper attribution to the original author.
By using this code, you acknowledge understanding and acceptance of these terms.