
Volatility Bands Pro
This Thinkorswim Volatility Bands Pro indicator is designed to help you identify potential price extremes and trend continuations with enhanced clarity.
Indicator Code
thinkscriptdeclare upper;
input length = 20;
input sd1 = 1.0;
input sd2 = 2.0;
input sd3 = 3.0;
input showLabels = yes; # New input for labels
def meanPrice = Average(close, length);
def stdDev = StDev(close, length);
plot Mean = meanPrice;
Mean.SetDefaultColor(Color.YELLOW);
Mean.SetLineWeight(2);
Mean.SetStyle(Curve.FIRM);
plot Upper1SD = meanPrice + (sd1 * stdDev);
Upper1SD.SetDefaultColor(Color.LIGHT_GREEN);
Upper1SD.SetLineWeight(1);
plot Upper2SD = meanPrice + (sd2 * stdDev);
Upper2SD.SetDefaultColor(Color.GREEN);
Upper2SD.SetLineWeight(1);
plot Upper3SD = meanPrice + (sd3 * stdDev);
Upper3SD.SetDefaultColor(Color.DARK_GREEN);
Upper3SD.SetLineWeight(1);
plot Lower1SD = meanPrice - (sd1 * stdDev);
Lower1SD.SetDefaultColor(Color.LIGHT_RED);
Lower1SD.SetLineWeight(1);
plot Lower2SD = meanPrice - (sd2 * stdDev);
Lower2SD.SetDefaultColor(Color.RED);
Lower2SD.SetLineWeight(1);
plot Lower3SD = meanPrice - (sd3 * stdDev);
Lower3SD.SetDefaultColor(Color.DARK_RED);
Lower3SD.SetLineWeight(1);
AddLabel(showLabels, "Mean: " + Round(meanPrice, 2), Color.YELLOW);
AddLabel(showLabels, "Upper 1SD: " + Round(Upper1SD, 2), Color.LIGHT_GREEN);
AddLabel(showLabels, "Lower 1SD: " + Round(Lower1SD, 2), Color.LIGHT_RED);
AddLabel(showLabels, "Upper 2SD: " + Round(Upper2SD, 2), Color.GREEN);
AddLabel(showLabels, "Lower 2SD: " + Round(Lower2SD, 2), Color.RED);
AddLabel(showLabels, "Upper 3SD: " + Round(Upper3SD, 2), Color.DARK_GREEN);
AddLabel(showLabels, "Lower 3SD: " + Round(Lower3SD, 2), Color.DARK_RED);Original Author Credit
Created by: NiceBreakout
Website: https://www.Nicebreakout.com
Open ThinkorSwim and go to Charts > Studies (fx).
Click Edit Studies > then Create New Study.
Name your indicator (e.g., "My Custom Indicator").
Paste the ThinkScript code into the editor.
Click OK, then Apply to add it to your chart.
Quick Start Guide: Volatility Bands Pro
Congratulations on installing Volatility Bands Pro! This guide will help you quickly understand and utilize its powerful features to enhance your trading.
1. What You See on Your Chart:
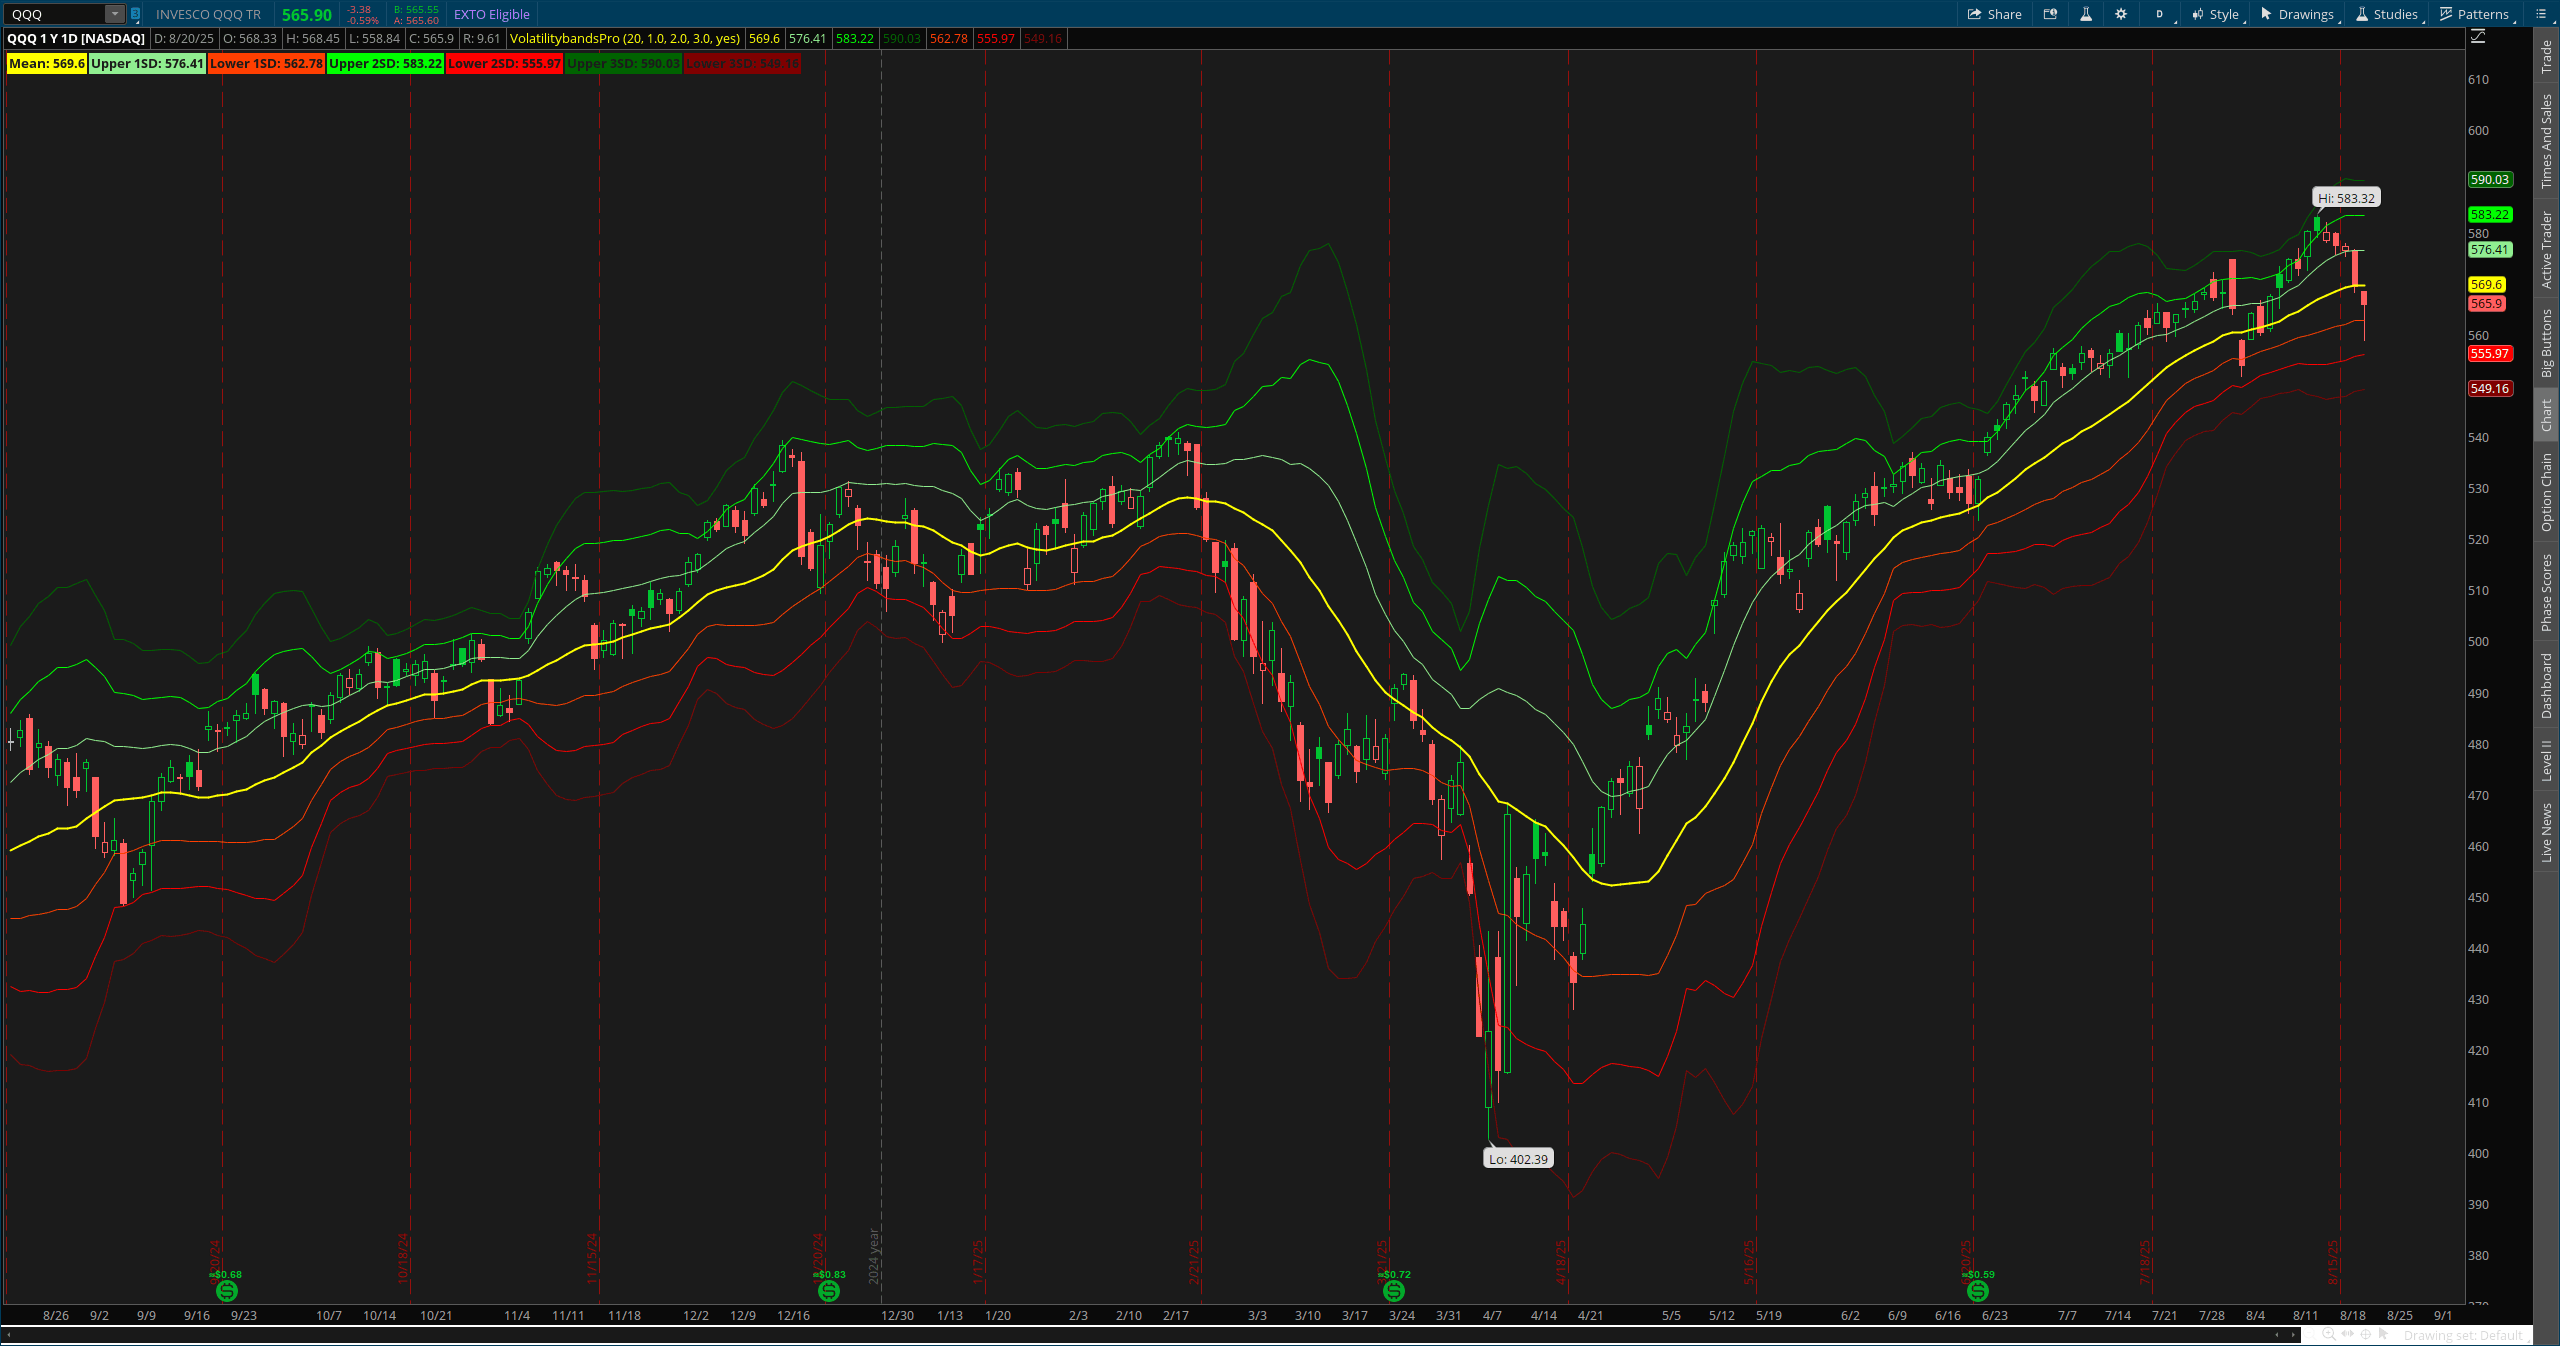
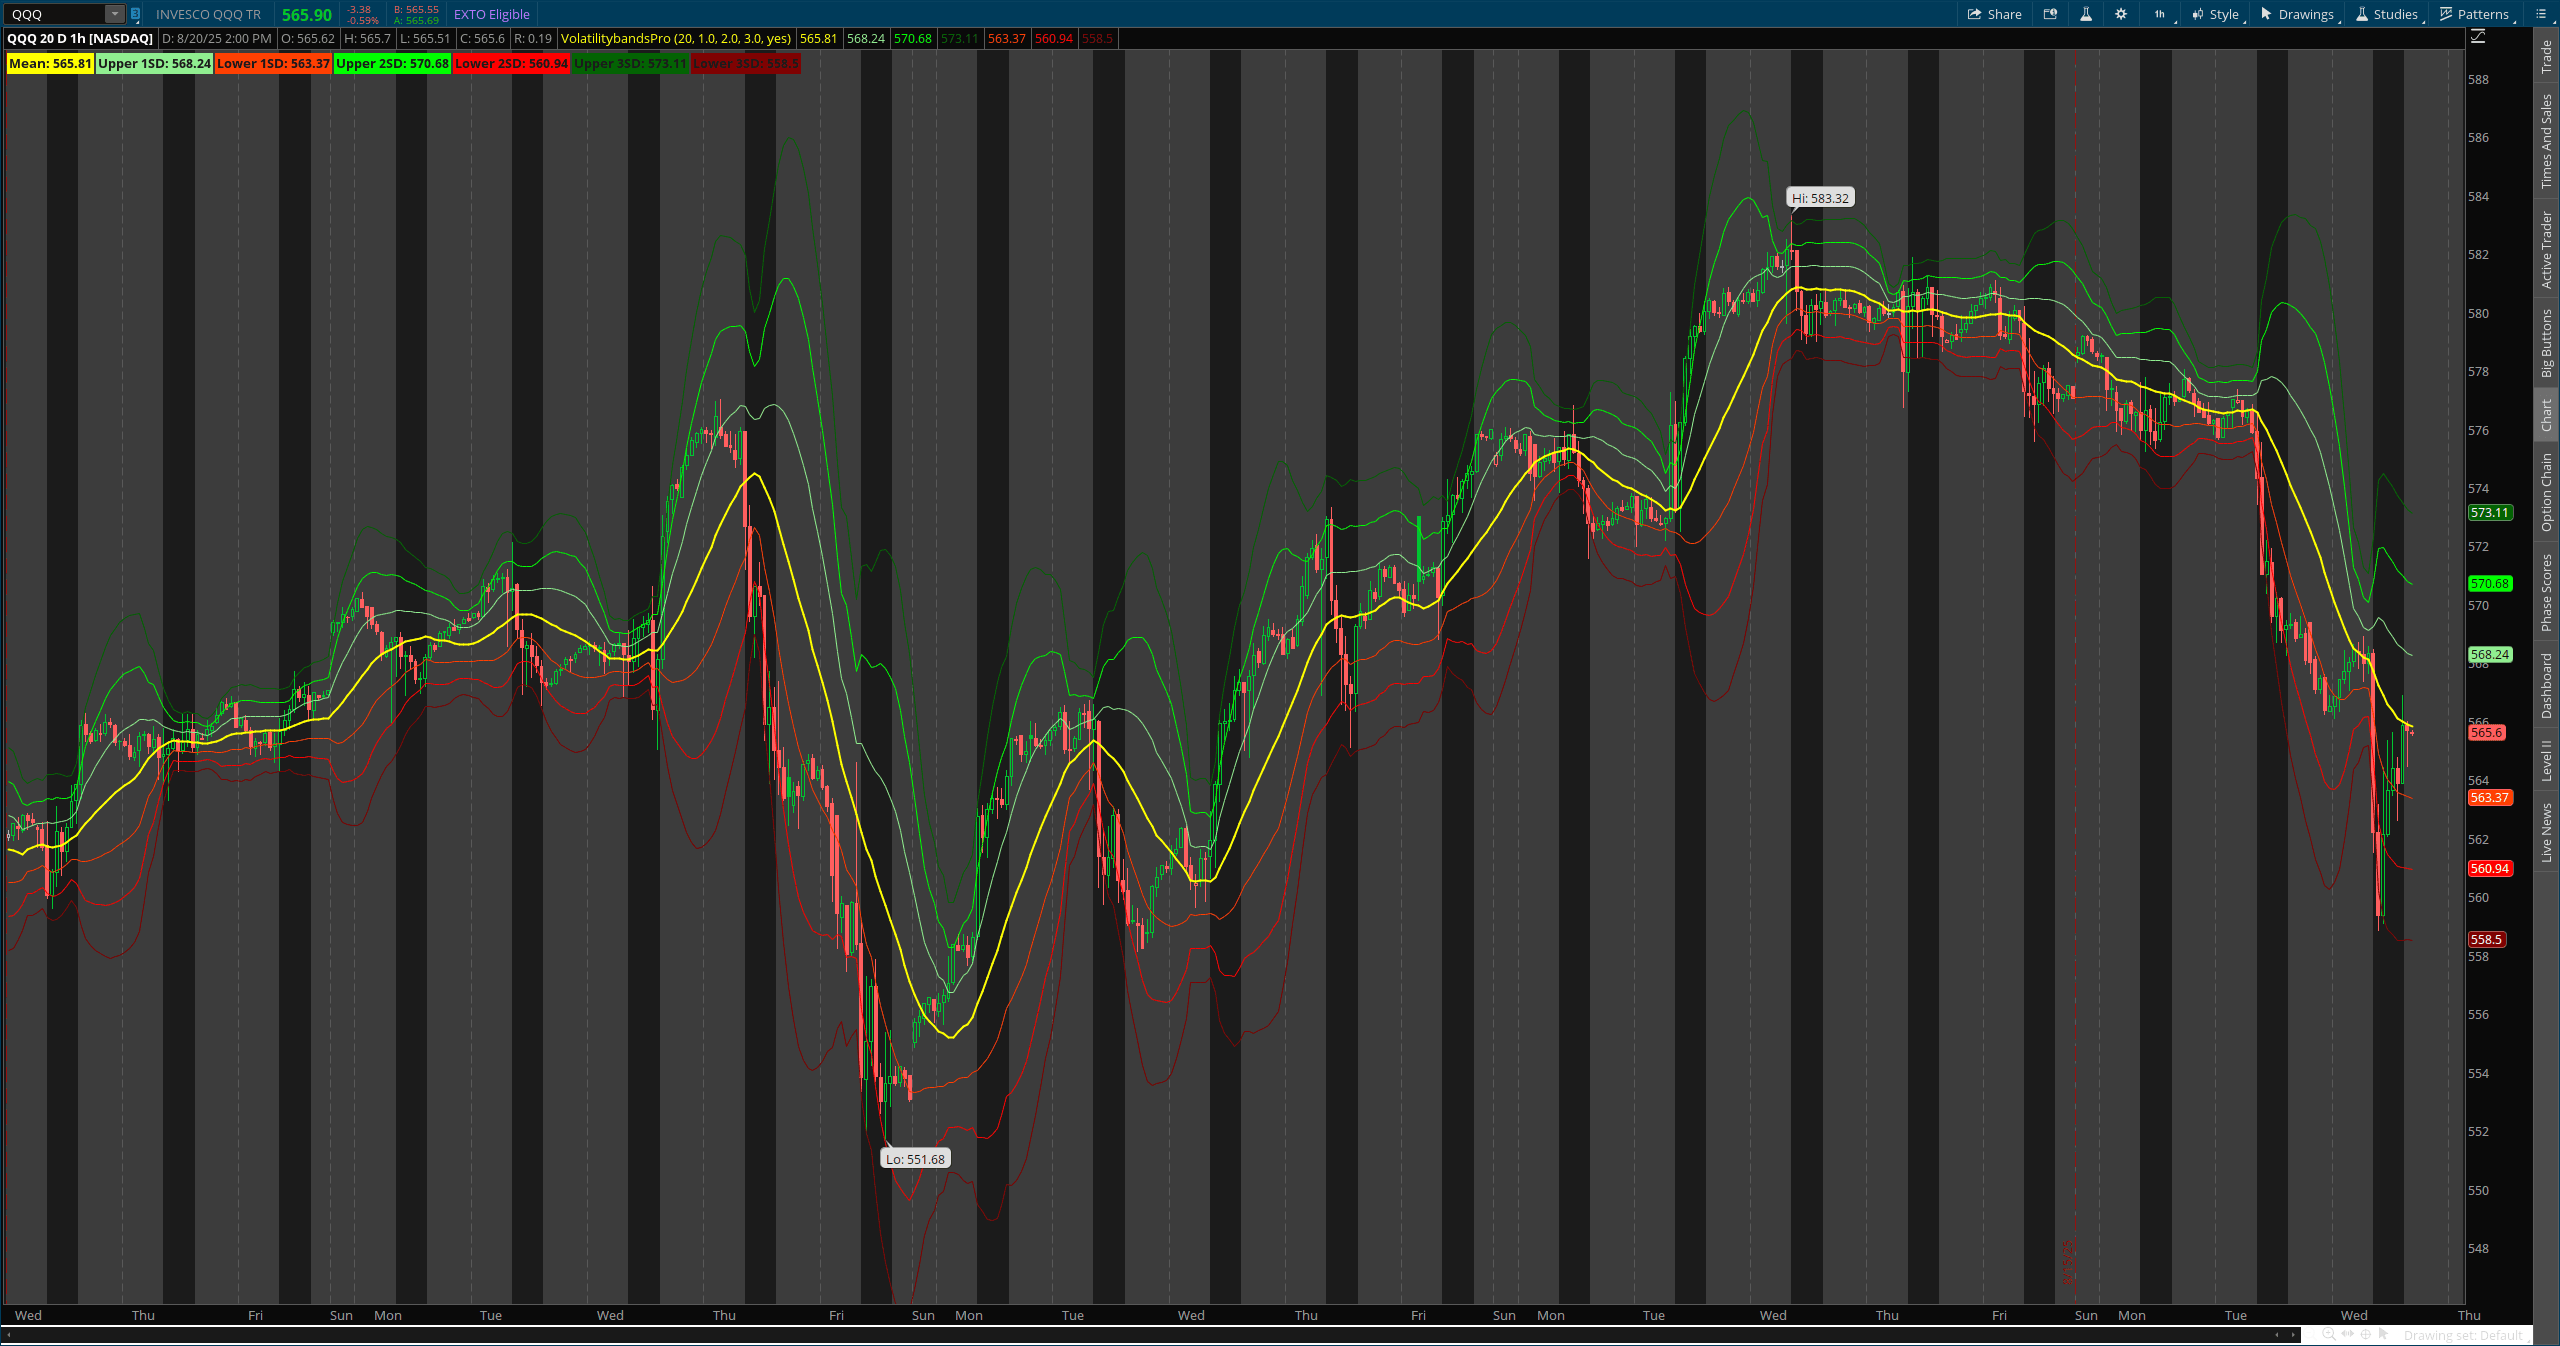
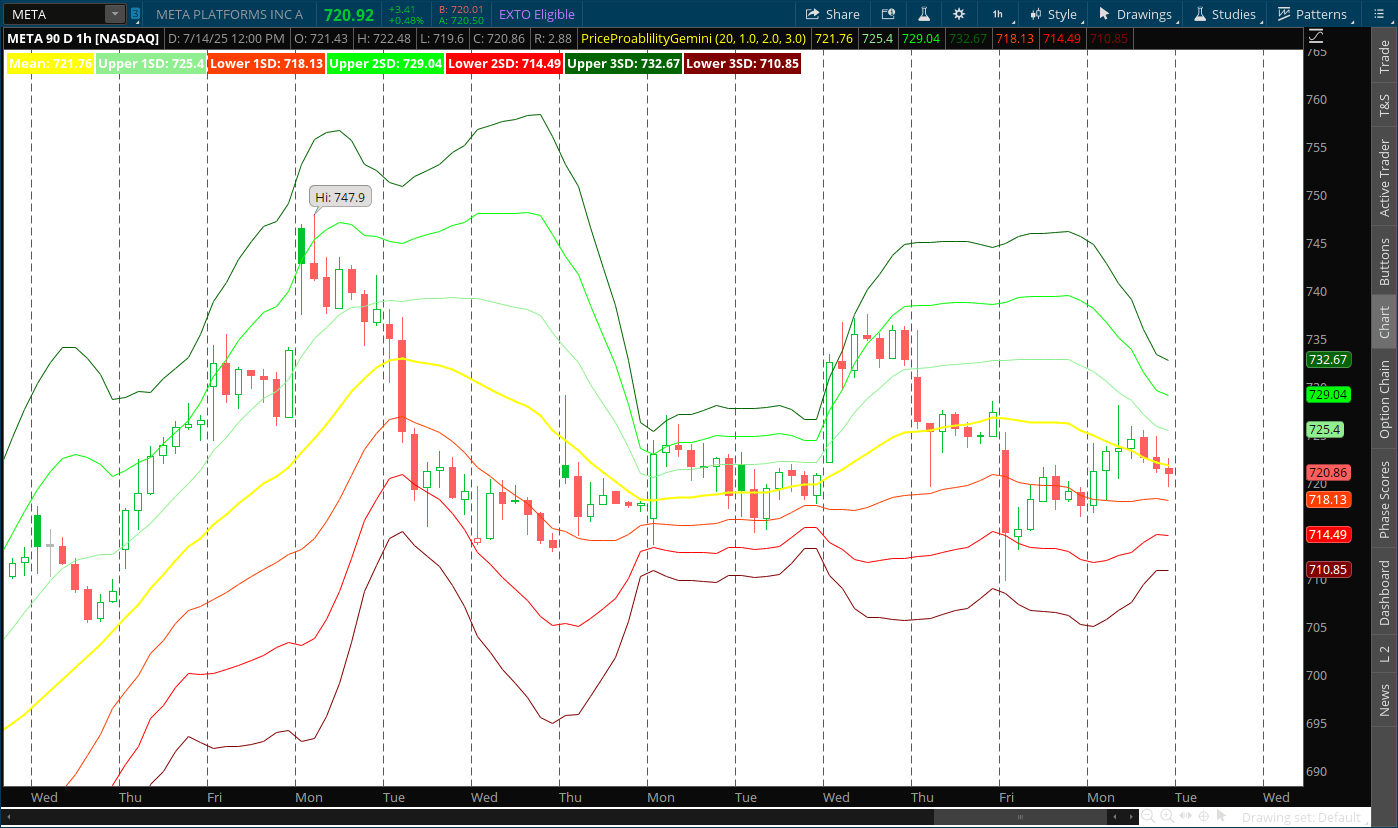
Once applied, you'll see a series of lines plotted directly on your price chart:
Yellow Line (Mean): This is the central moving average of the price, representing the average price over a set period. It acts as the "center of gravity" for price action.
Green Lines (Upper Bands): These are the Upper Standard Deviation Bands (1SD, 2SD, 3SD). They indicate potential overbought conditions or resistance levels.
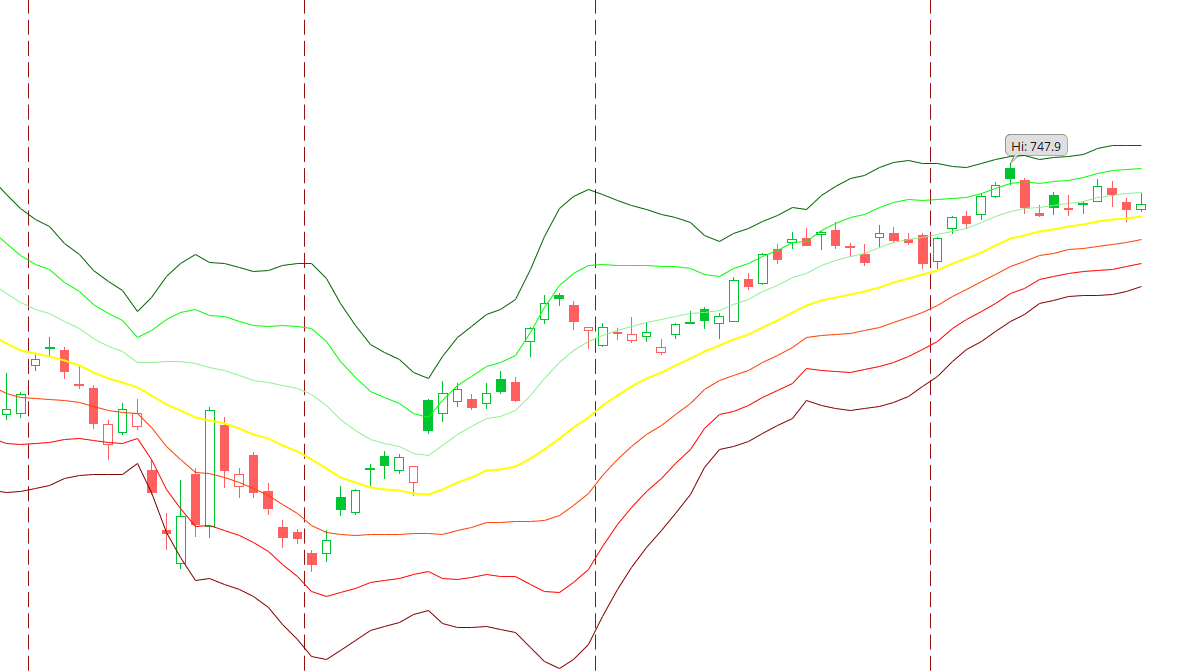
Light Green (Upper 1SD): Inner band, mild overbought.
Green (Upper 2SD): Middle band, significant overbought.
Dark Green (Upper 3SD): Outer band, extreme overbought.
Red Lines (Lower Bands): These are the Lower Standard Deviation Bands (1SD, 2SD, 3SD). They indicate potential oversold conditions or support levels.
Light Red (Lower 1SD): Inner band, mild oversold.
Red (Lower 2SD): Middle band, significant oversold.
Dark Red (Lower 3SD): Outer band, extreme oversold.
Labels (Optional): On the left side of your chart, you'll see real-time numeric values for each band, updated constantly.
2. Accessing Indicator Settings:
To customize Volatility Bands Pro, follow these steps (exact steps may vary slightly depending on your trading platform, e.g., ThinkOrSwim, MetaTrader, TradingView):
Right-click on the chart where the indicator is applied.
Select "Studies" or "Indicators List" (or similar option).
Find "Volatility Bands Pro" in the list and click the "Settings" or "Edit" icon (often a gear or pencil).
3. Key Settings You Can Adjust:
In the settings window, you'll find these important inputs:
length (Default: 20): This controls the period for the central moving average and the standard deviation calculation.
Higher length: Smoother bands, less responsive to short-term price changes. Good for longer-term analysis.
Lower length: More responsive bands, sensitive to short-term fluctuations. Good for shorter-term trading.
Experiment to find what works best for your timeframe!
sd1, sd2, sd3 (Defaults: 1.0, 2.0, 3.0): These represent the multiplier for each standard deviation band.
You can adjust these if you want to widen or narrow specific bands. For most users, the default settings are ideal as they align with statistical probabilities.
showLabels (Default: Yes):
Set to Yes to display the numeric labels on the chart.
Set to No if you prefer a cleaner chart without the label display.
4. Basic Interpretation & Trading Ideas:
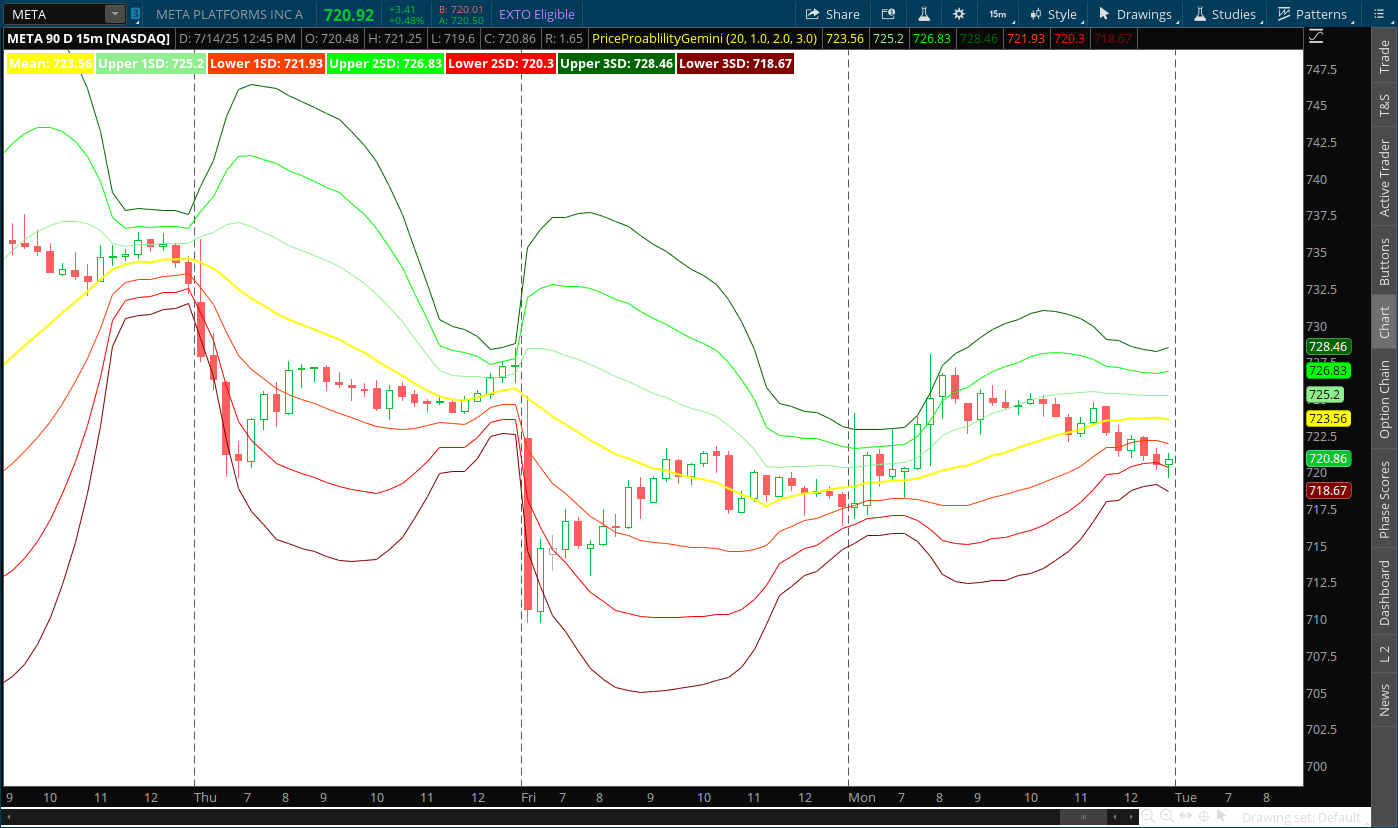
Volatility Bands Pro is excellent for understanding price behavior within its normal range and identifying potential reversals.
Reversion to the Mean: Prices tend to revert to the Yellow (Mean) line. If price moves far from the mean, especially towards the outer bands, it often signals a potential pull-back towards the mean.
Overbought/Oversold Conditions:
Price touching/breaking Upper Bands (Green): Suggests the asset is becoming overbought. The further out (2SD, 3SD), the more extreme the condition, increasing the probability of a downward correction or reversal.
Price touching/breaking Lower Bands (Red): Suggests the asset is becoming oversold. The further out (2SD, 3SD), the more extreme the condition, increasing the probability of an upward correction or reversal.
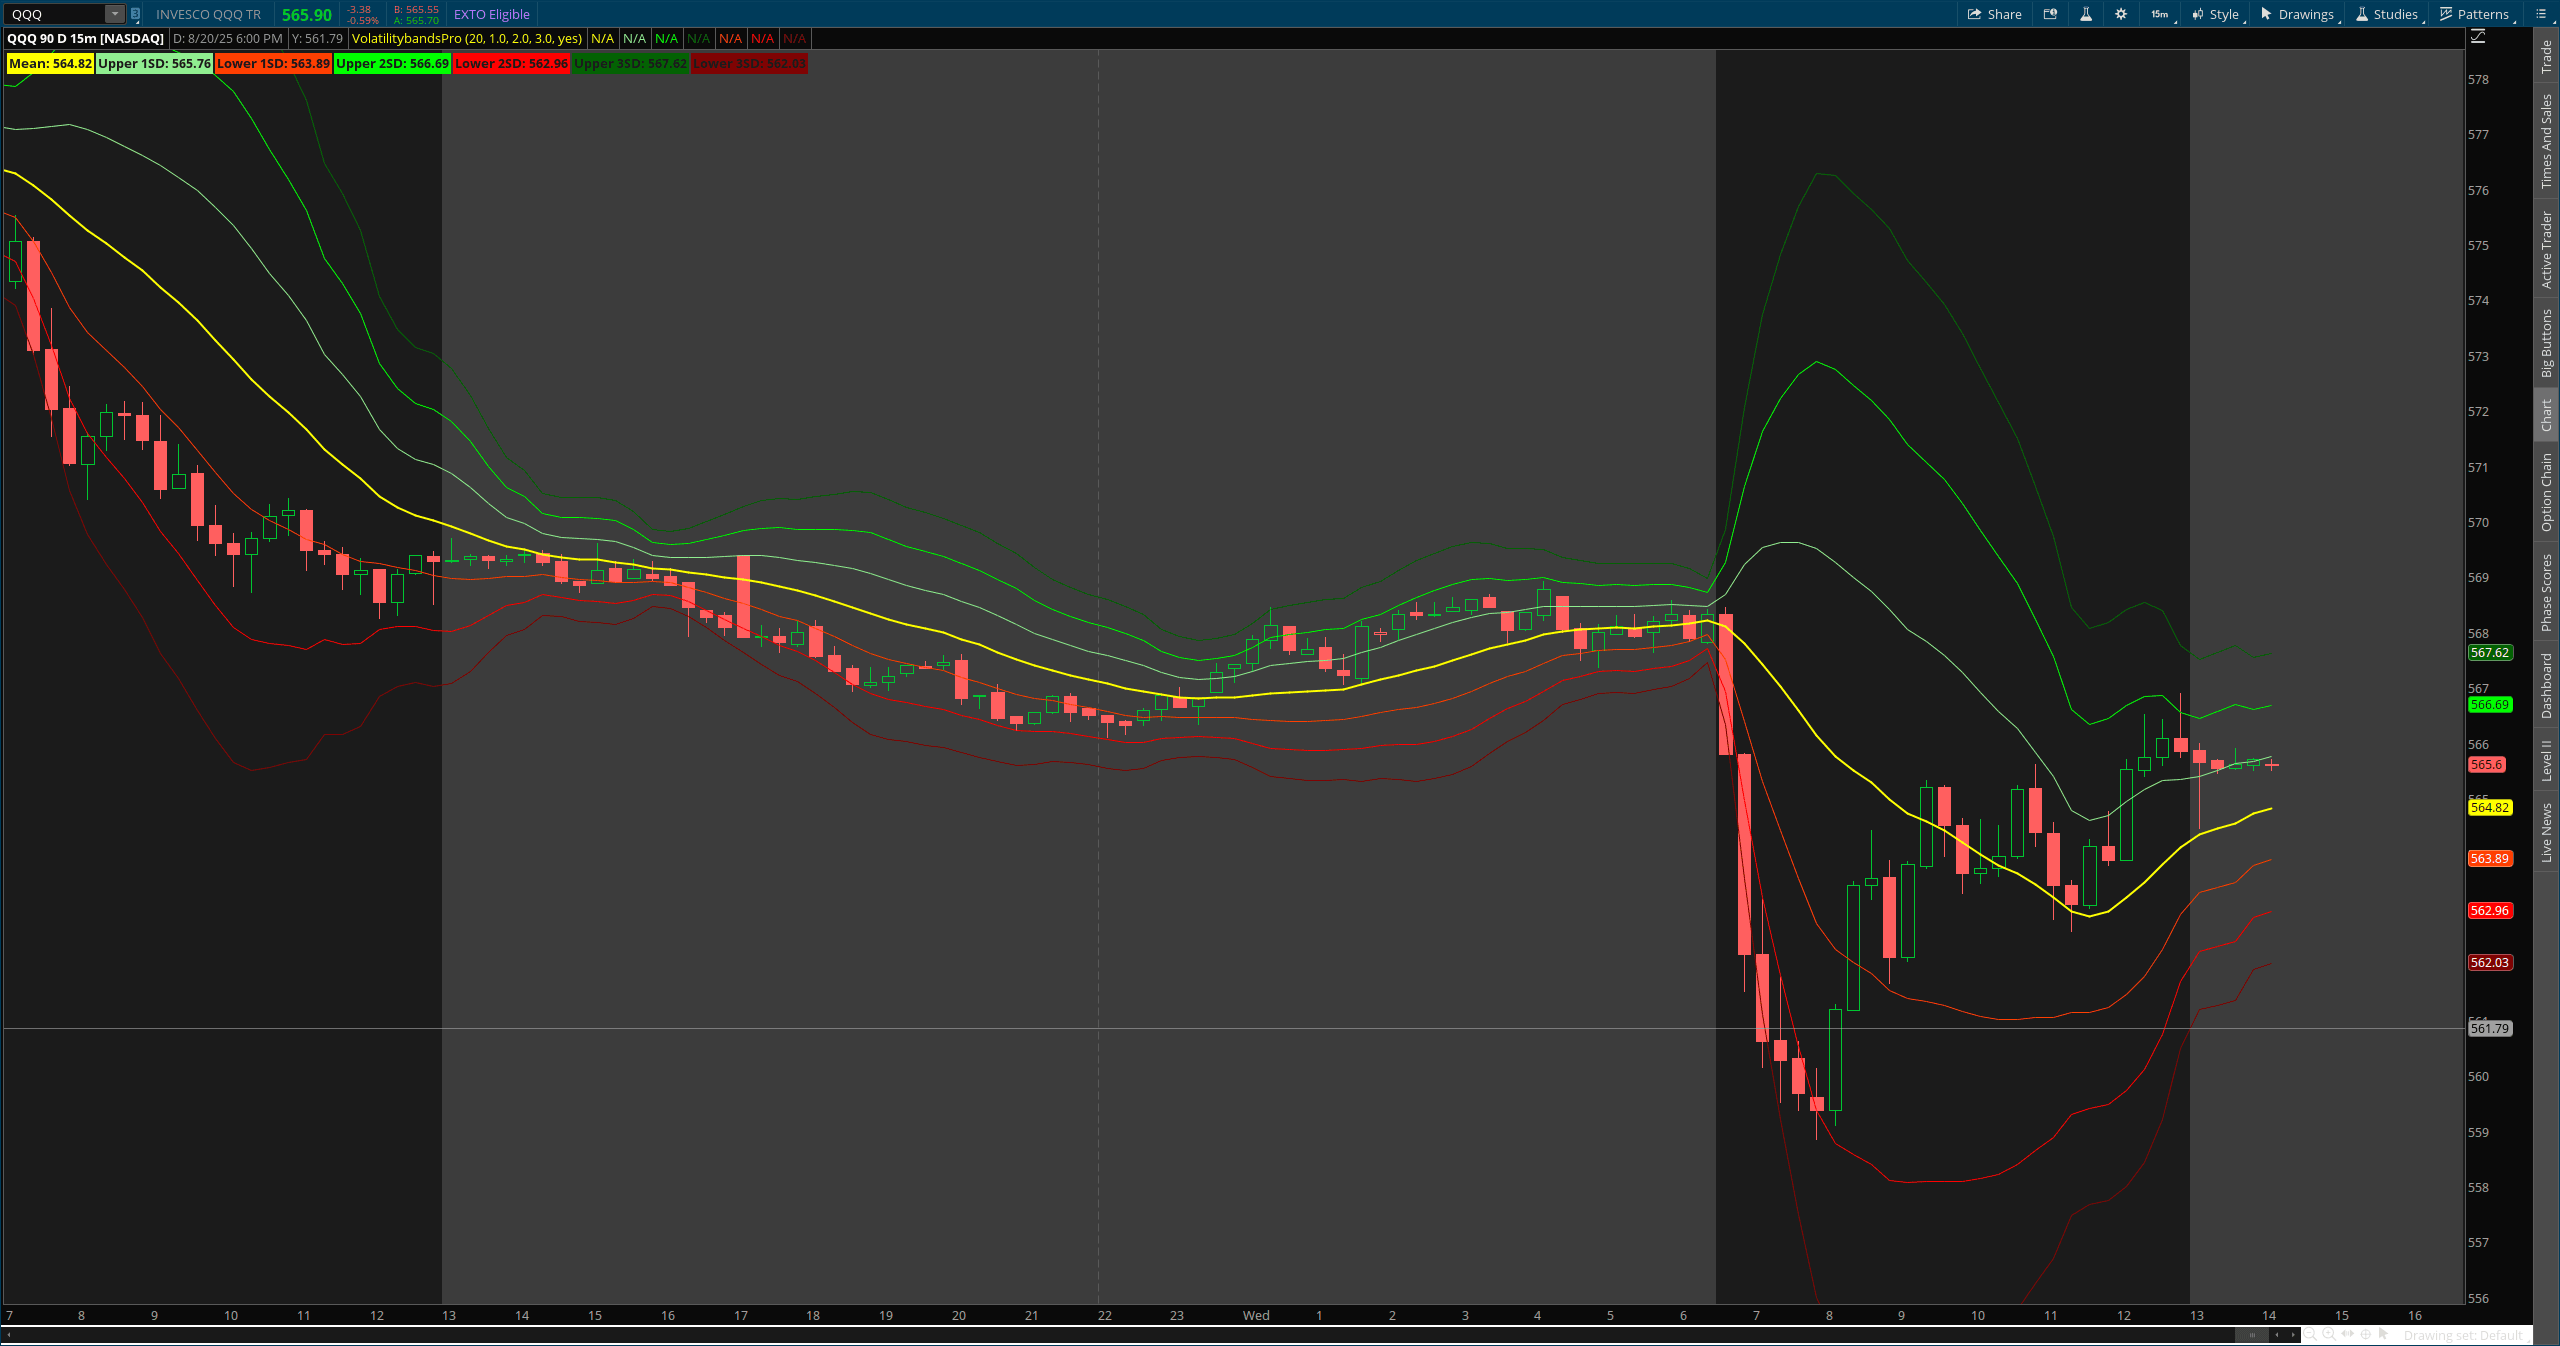
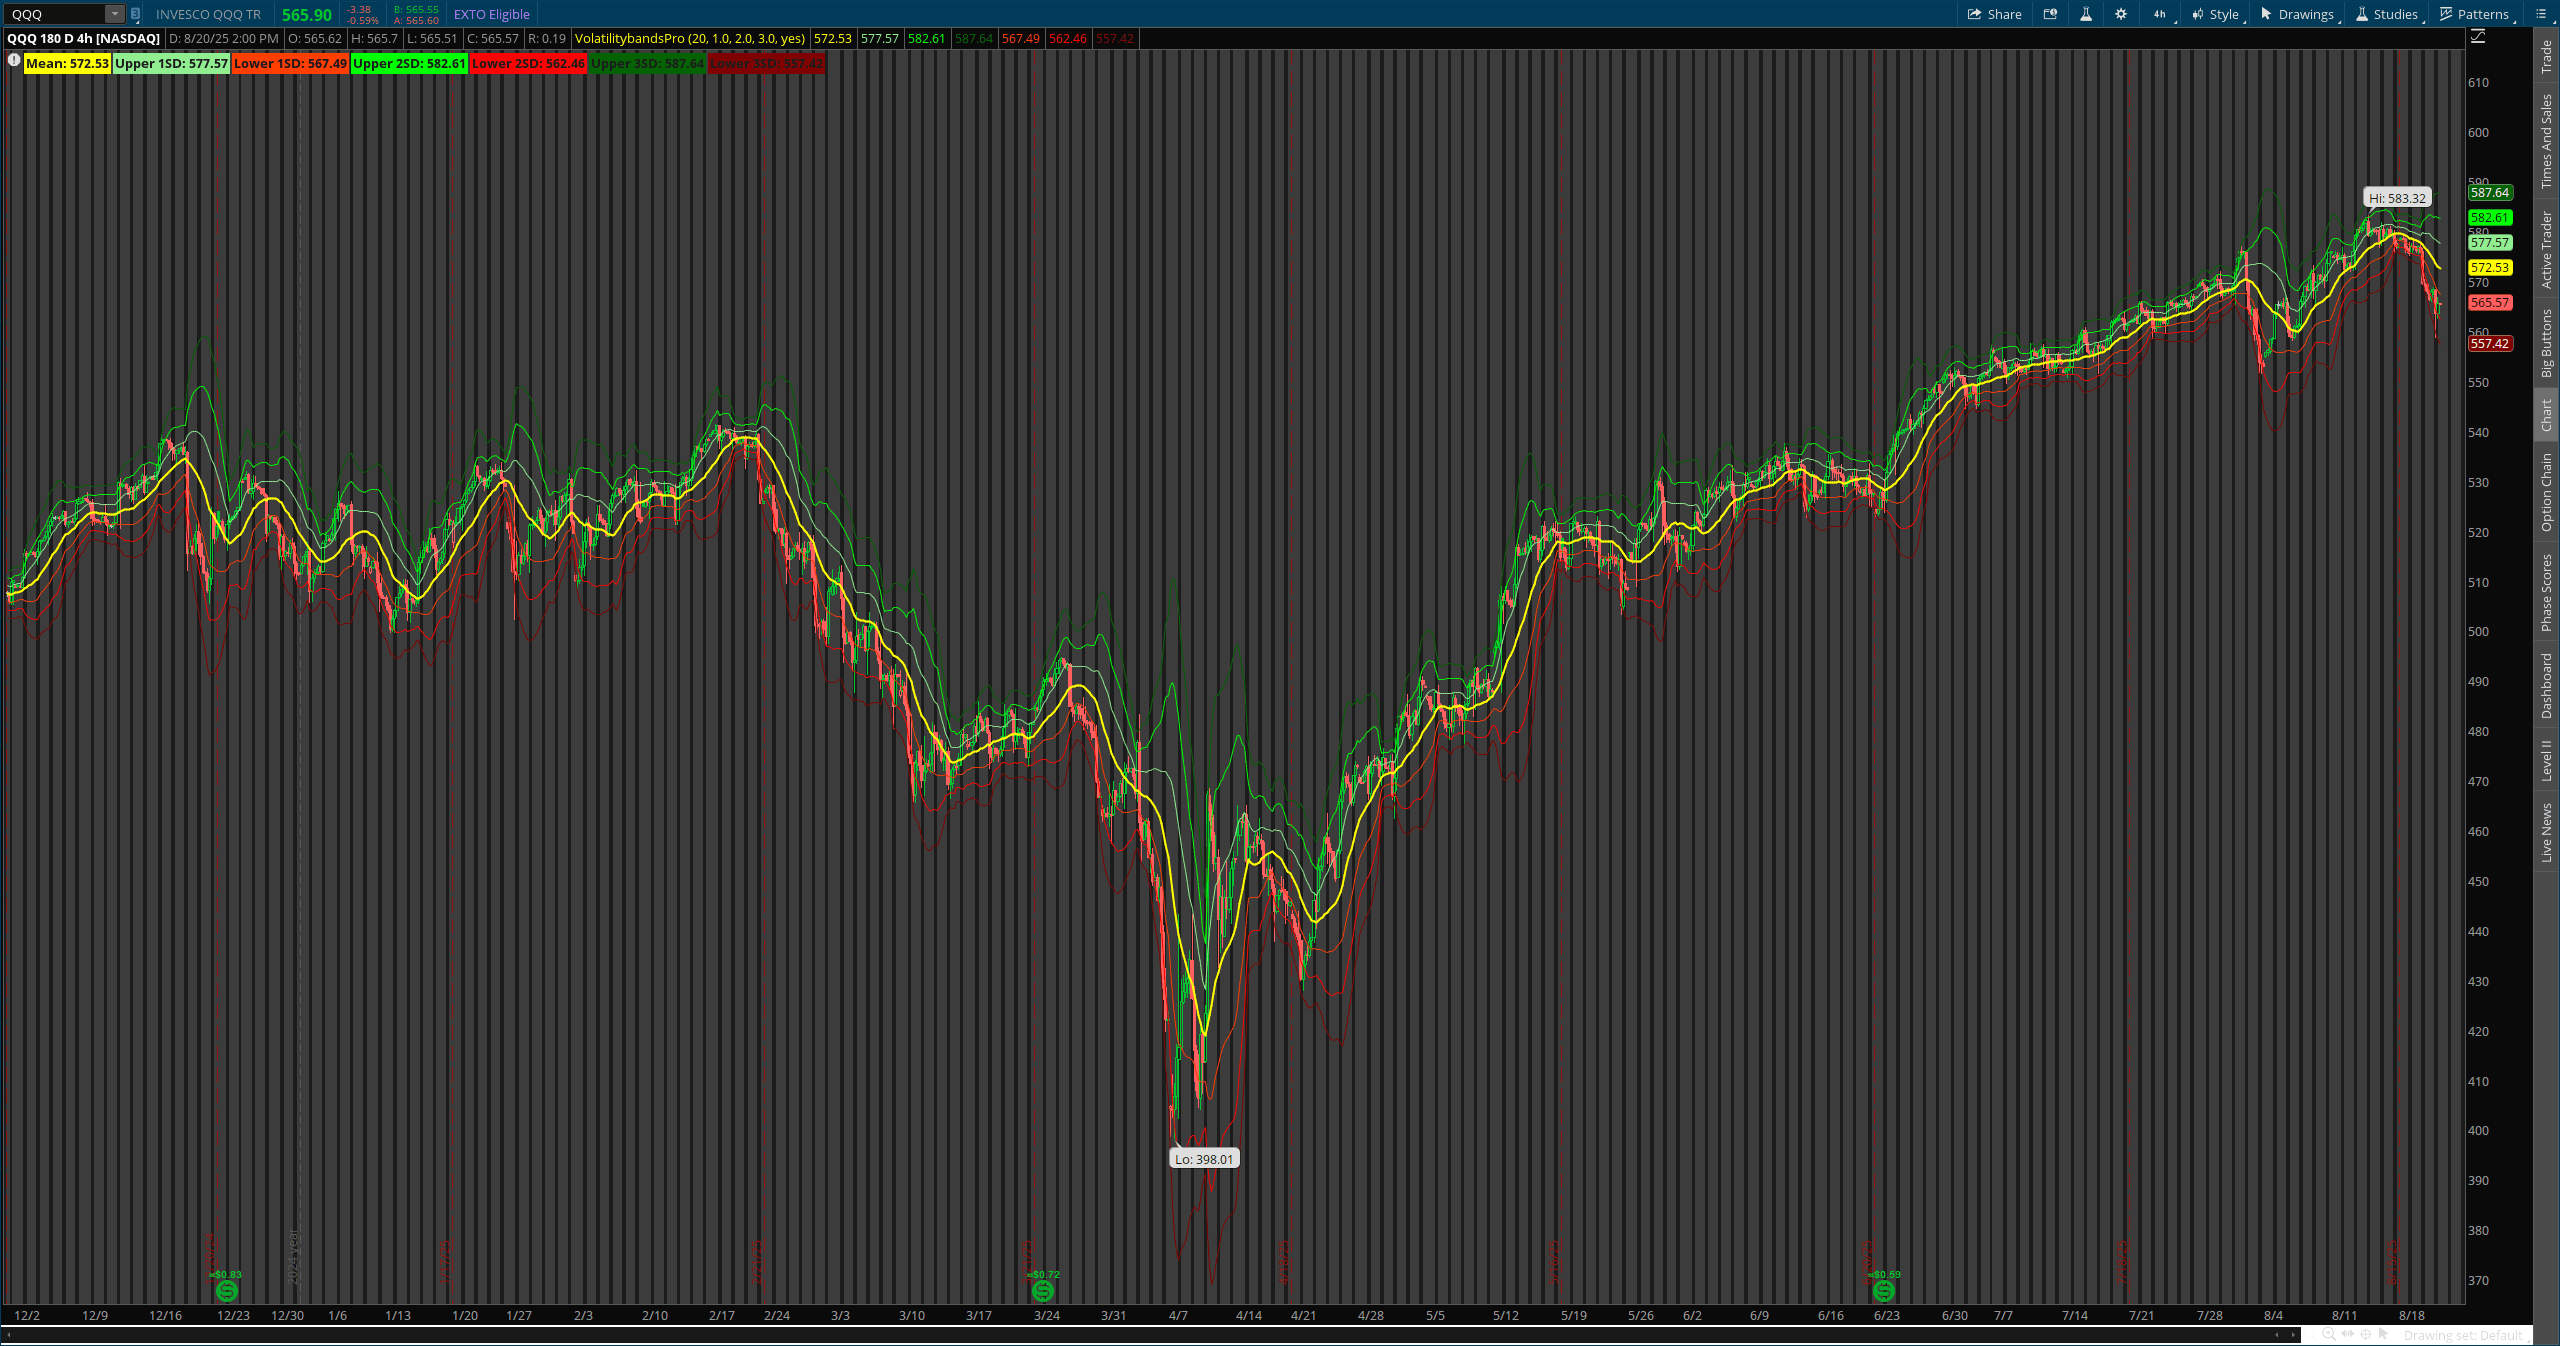
Volatility Expansion/Contraction:
Widening Bands: Indicate increasing market volatility. Prices are moving more dramatically.
Narrowing Bands: Indicate decreasing market volatility. Often precedes a significant price move (a "squeeze").
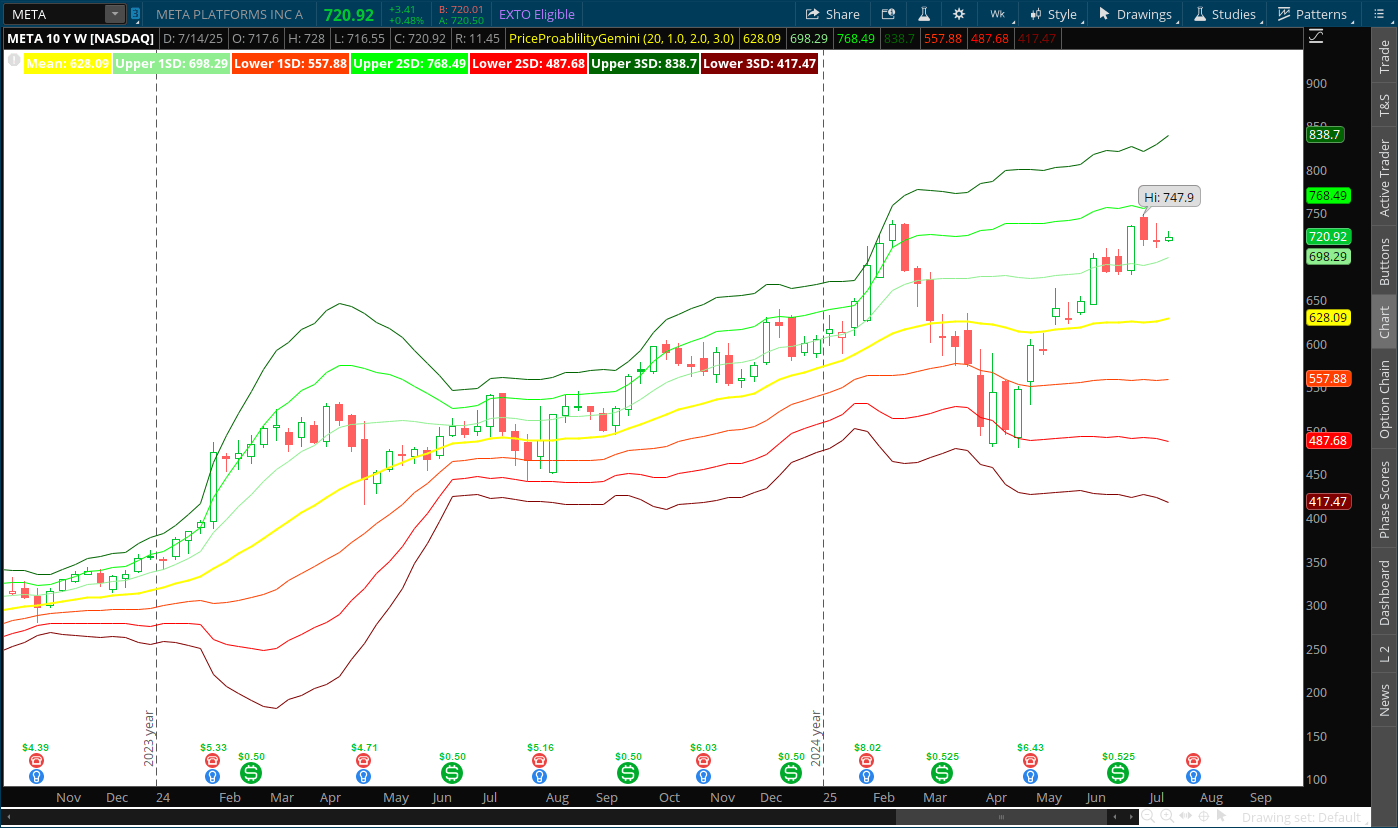
Trend Confirmation/Breaks:
In an uptrend, price often stays above the Mean line and may bounce off the lower bands. A break below the Mean or lower bands could signal a trend weakening.
In a downtrend, price often stays below the Mean line and may bounce off the upper bands. A break above the Mean or upper bands could signal a trend weakening.
Important Note: Indicators are best used in conjunction with other analysis tools and your overall trading strategy. Volatility Bands Pro provides valuable context, but it's not a standalone signal generator.
What is Volatility Bands Pro?
Volatility Bands Pro plots a central moving average alongside multiple standard deviation bands, both above and below the mean. These bands expand and contract with market volatility, providing a visual representation of price dispersion. Unlike traditional fixed-width channels, our Volatility Bands Pro dynamically adjusts to current market conditions, giving you a more accurate and responsive tool for your trading decisions.
How Does It Work?
At its core, Volatility Bands Pro utilizes a moving average of the closing price to determine the central tendency of the market. Around this mean, it then calculates and plots three distinct sets of standard deviation bands:
- 1 Standard Deviation (1SD) Bands: These inner bands represent approximately 68% of price action. Prices often revert to the mean from these bands, making them useful for identifying minor turning points or confirming trend strength.
- 2 Standard Deviation (2SD) Bands: Encompassing roughly 95% of price data, these middle bands highlight more significant overbought or oversold conditions. A touch or breach of these bands often signals a strong potential for a price reversal or a continuation of an established trend if the price breaks out decisively.
- 3 Standard Deviation (3SD) Bands: Representing approximately 99.7% of price movements, these outer bands are considered extreme boundaries. Price reaching these levels suggests highly stretched market conditions and significantly increased probabilities of a strong reversal.
Key Features and Benefits:
- Dynamic Volatility Adjustment: The bands automatically widen during periods of high volatility and narrow during low volatility, always adapting to the market's pulse.
- Clear Visual Cues: Easily identify price extremes and potential reversal zones with color-coded bands (green for upper bands, red for lower bands).
- Multiple Standard Deviation Levels: Gain granular insight into price behavior with 1, 2, and 3 standard deviation levels, allowing for varied trading strategies based on risk appetite and market conditions.
- Customizable Length: Adjust the
lengthinput to control the sensitivity of the moving average and standard deviation calculations, tailoring the indicator to your preferred trading timeframe.
Note: This indicator code is provided free for educational purposes. Test thoroughly before using in live trading.
Legal Disclaimer & Risk Warning
Educational Purpose: This code is provided for educational and informational purposes only. It does not constitute financial, investment, or trading advice.
No Performance Guarantee: Past performance is not indicative of future results. Trading involves substantial risk, including potential loss of capital.
Test Thoroughly: Always test indicators in a paper trading environment before using real money. Verify compatibility with your platform version.
Use at Your Own Risk: You are solely responsible for your trading decisions. We are not liable for any losses resulting from use of this code.
Attribution: If you share or modify this code, please maintain proper attribution to the original author.
By using this code, you acknowledge understanding and acceptance of these terms.