
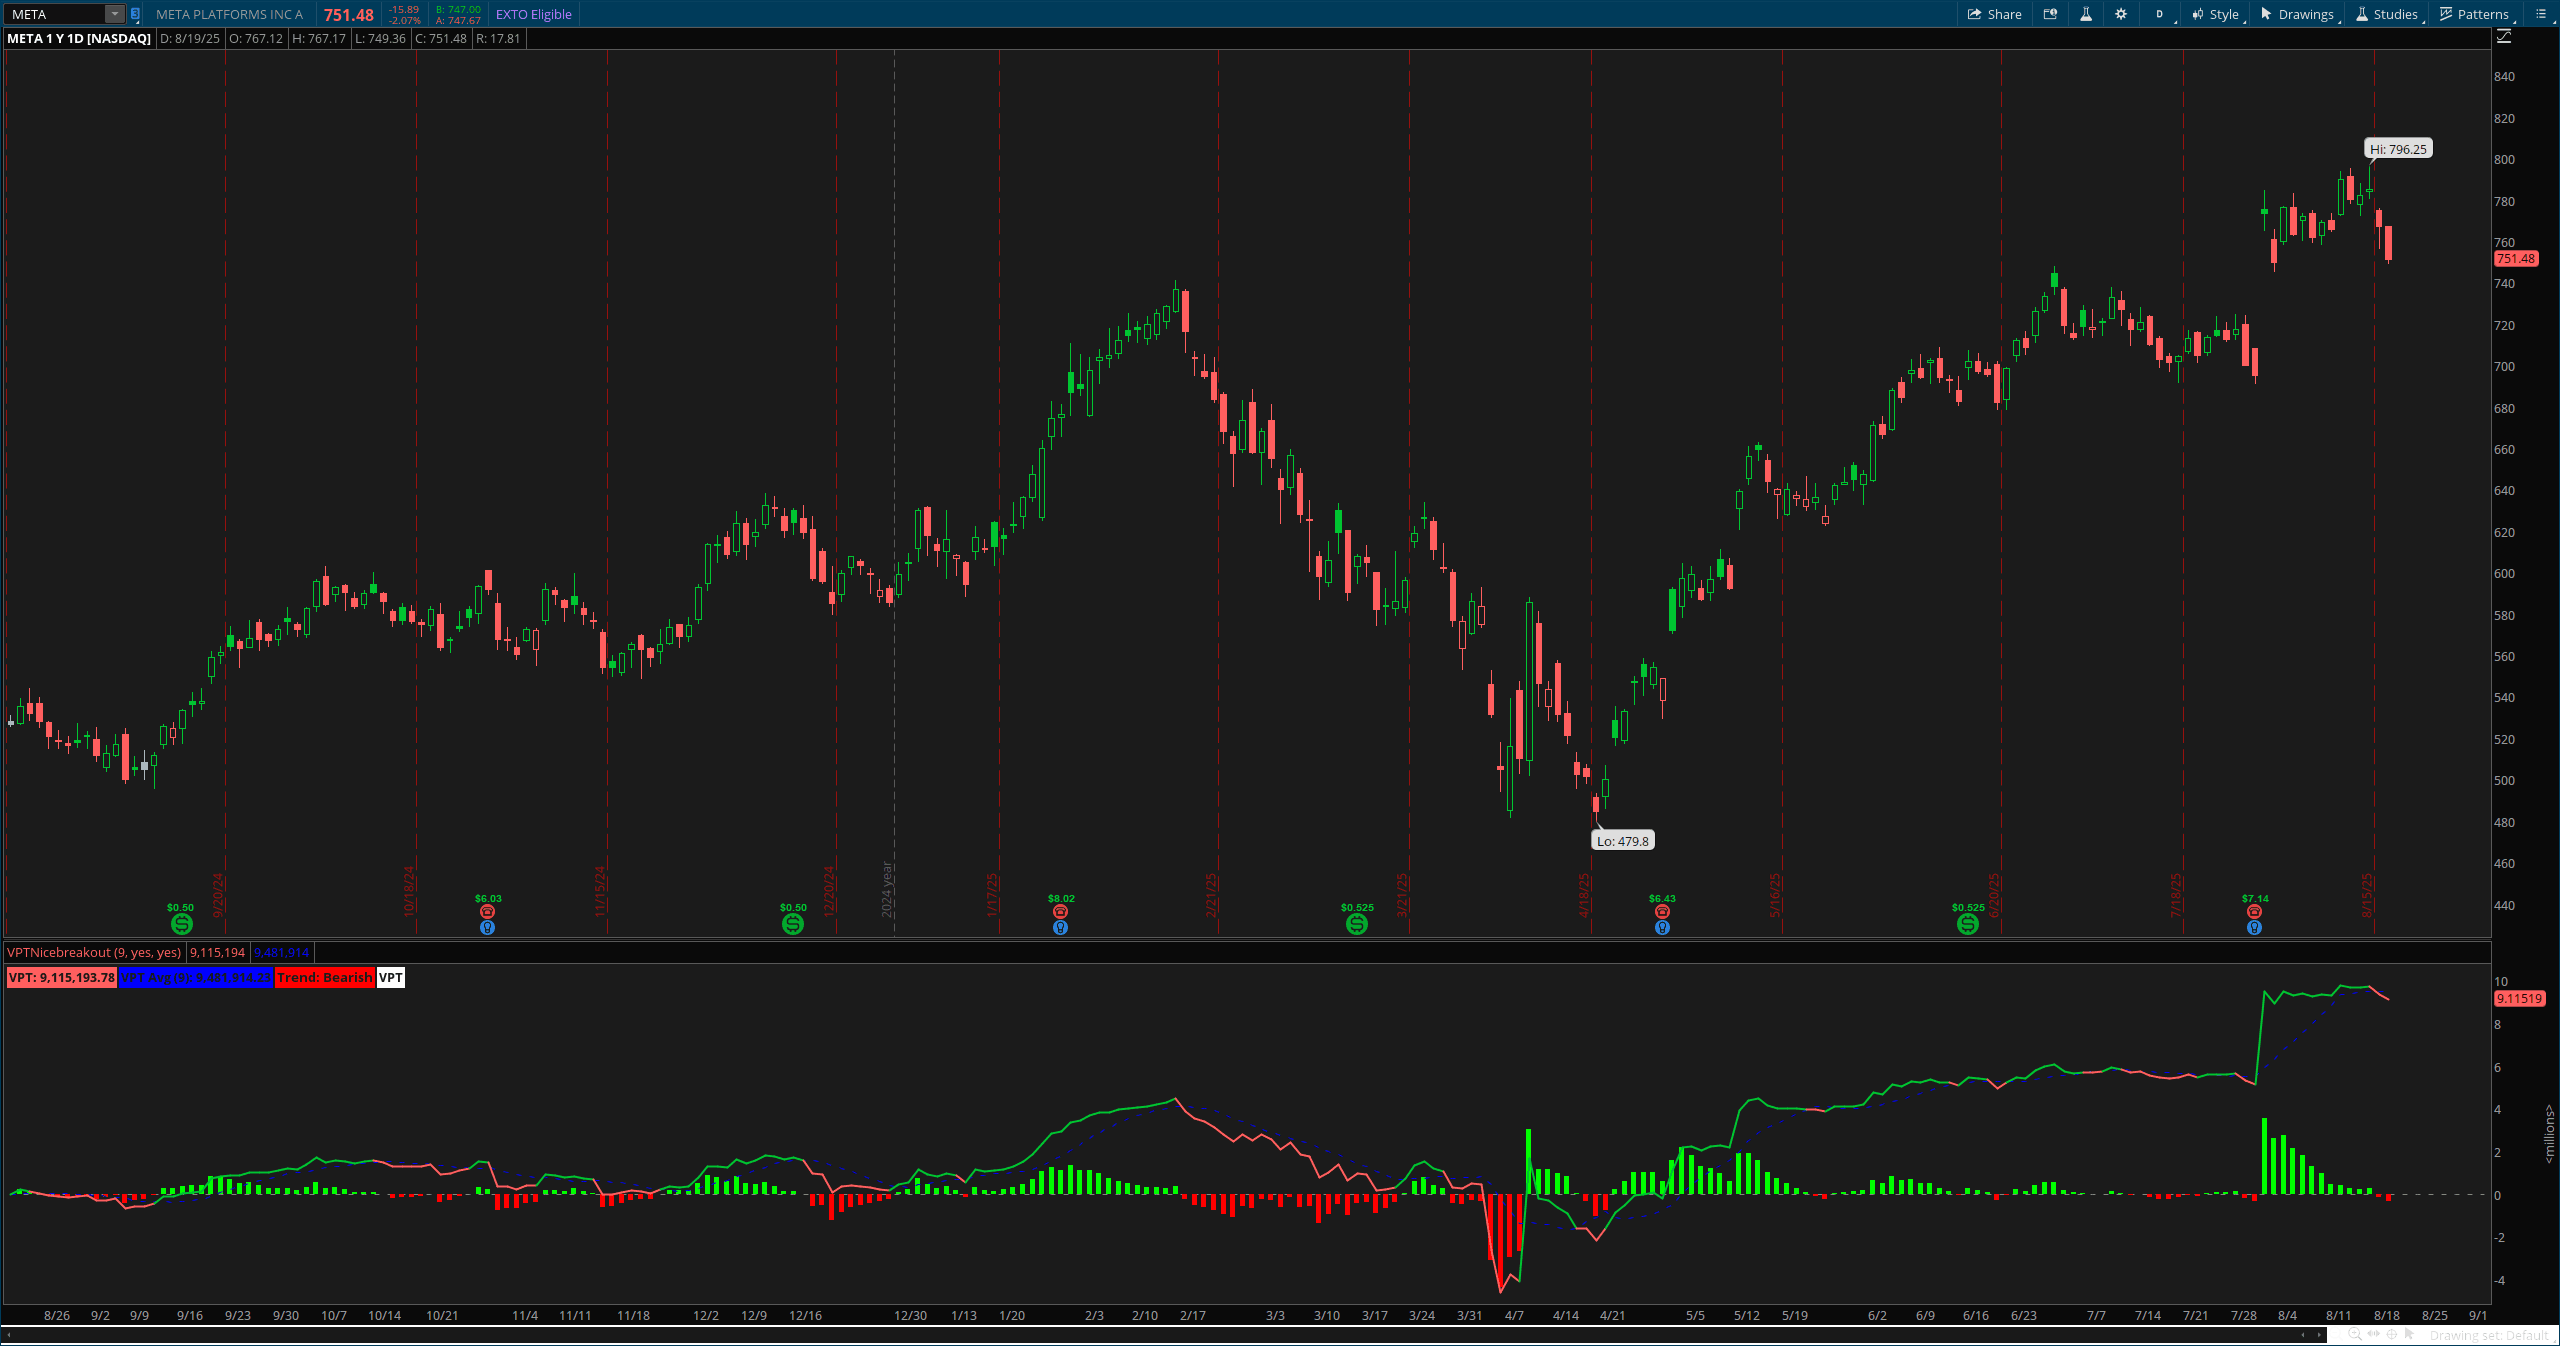
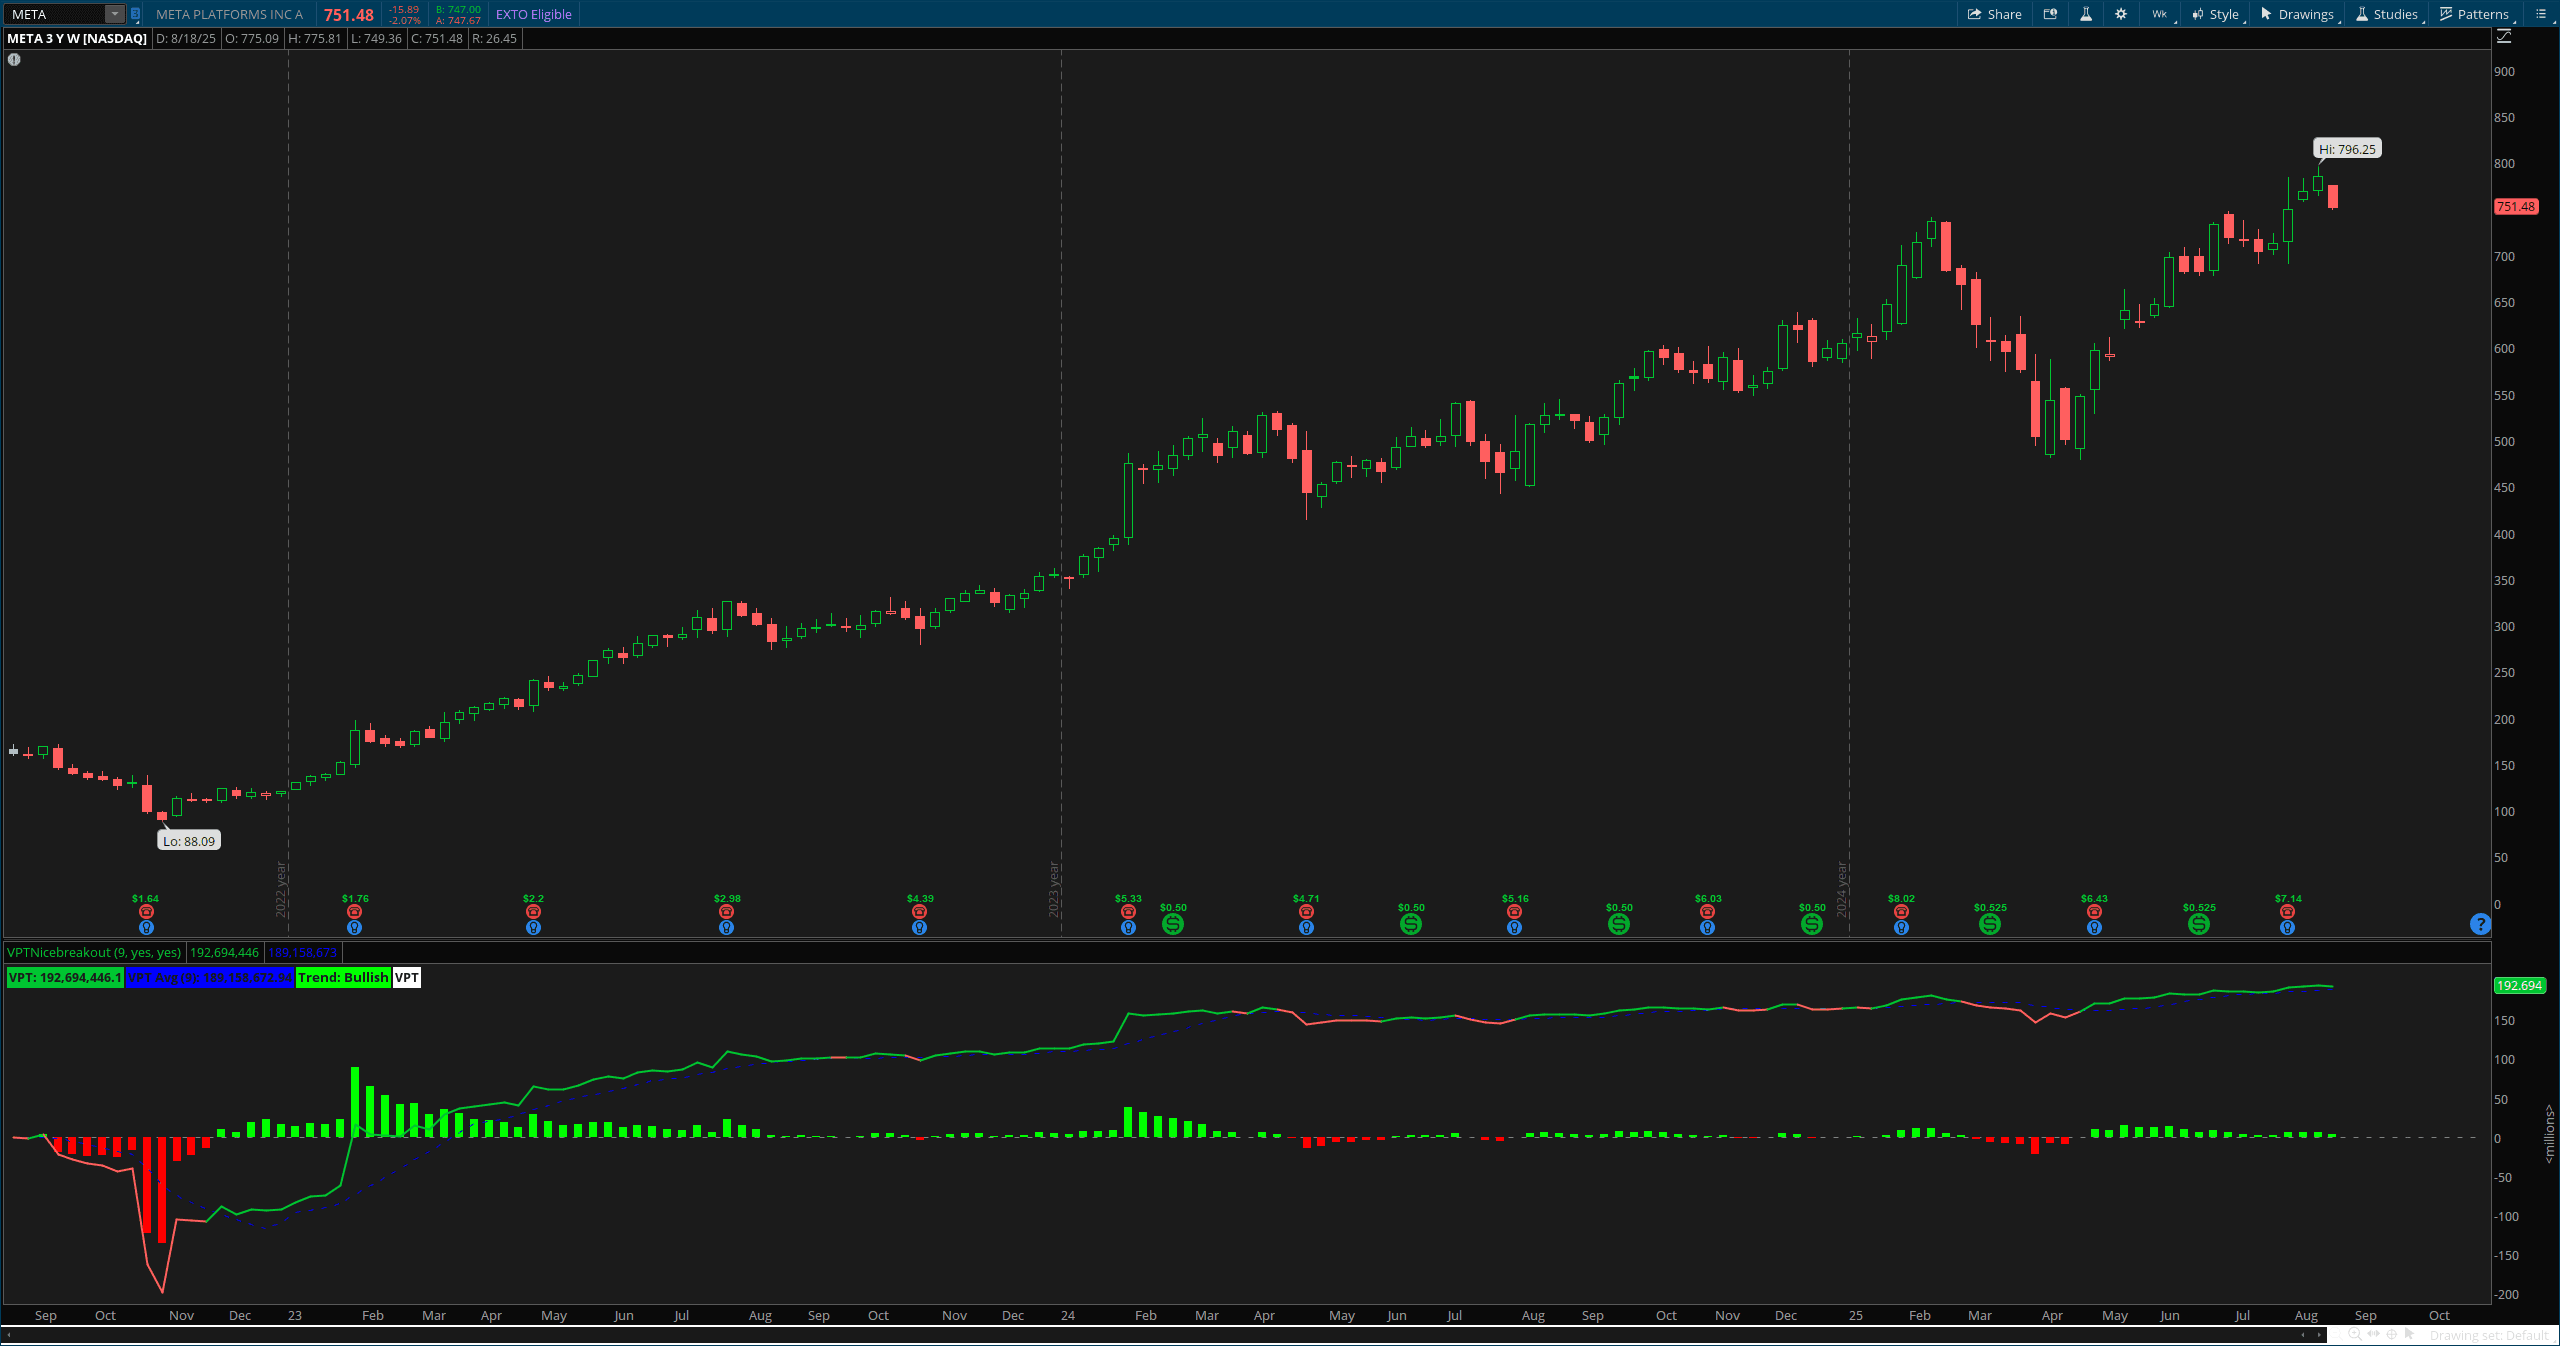
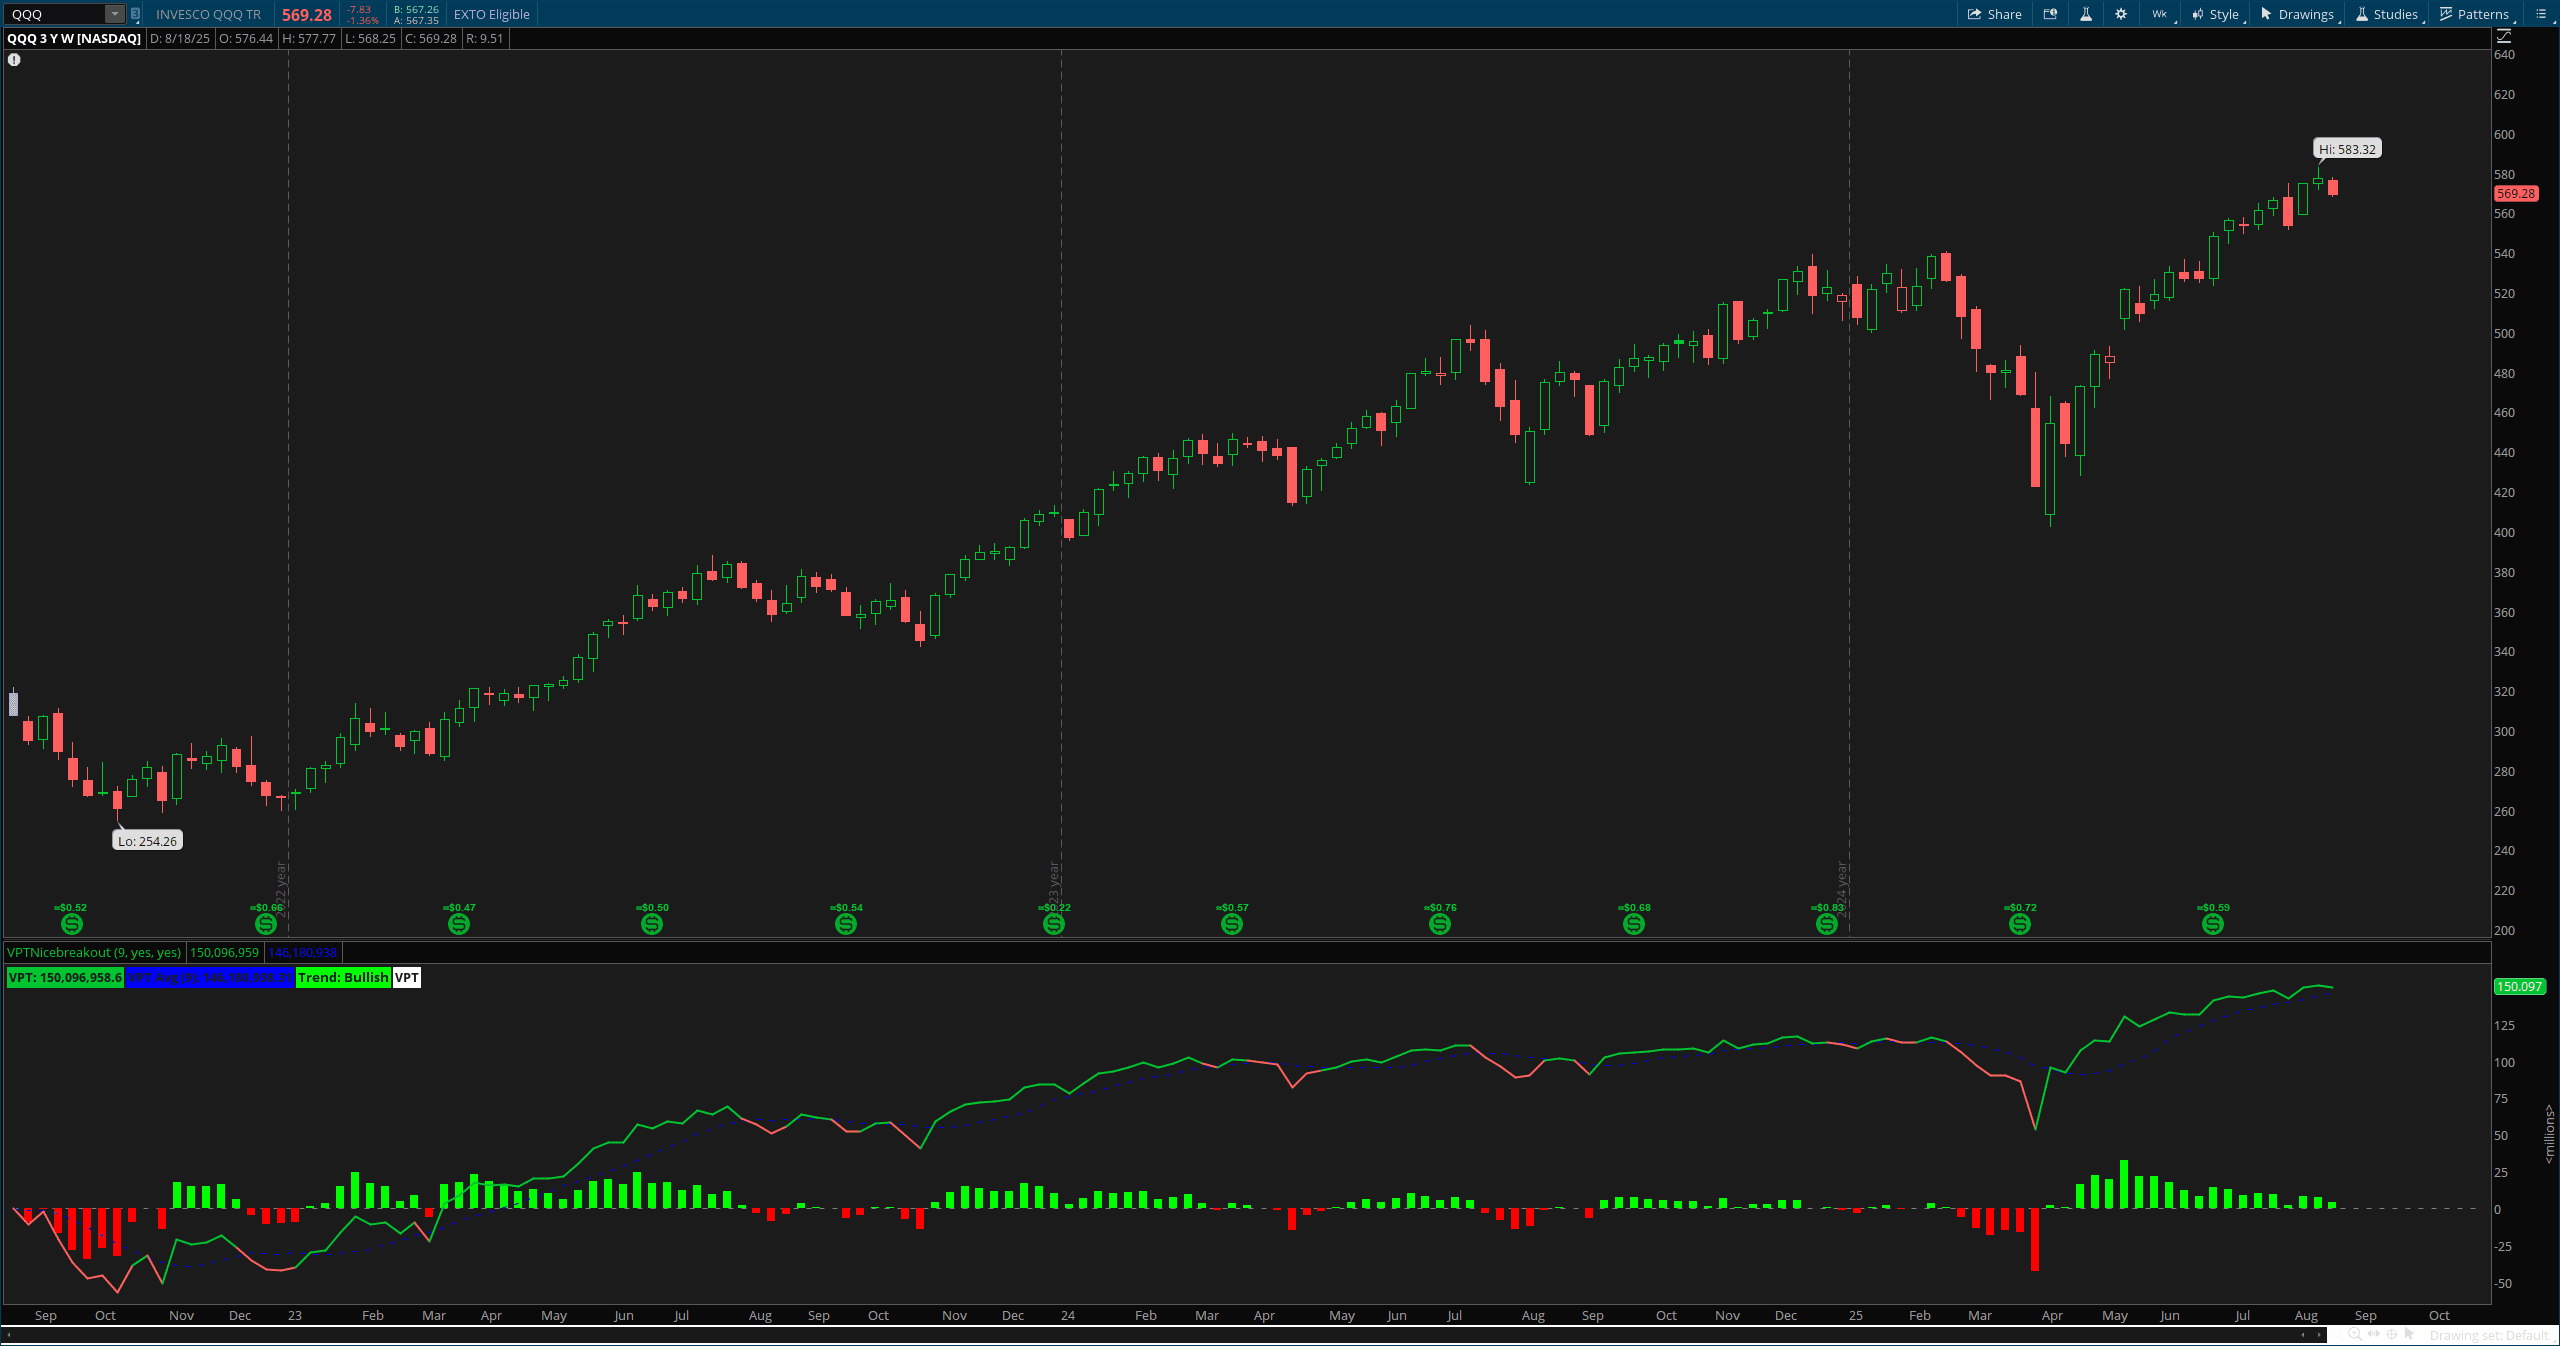
Volume Price Trend Pro (VPT)
This Thinkorswim Indicator is an advanced indicator combining volume and price action
Indicator Code
thinkscript#Volume Price Trend (VPT) - Enhanced Version
#Compatible with ThinkorSwim - No Syntax Errors
#author:Nicebreakout.com
declare lower;
input avgLength = 9;
input showHistogram = yes;
input showZeroLine = yes;
# --- Calculate Price Change ---
def closeChange = (close - close[1]) / close[1];
# --- Initialize VPT ---
def vptValue = CompoundValue(1, vptValue[1] + closeChange * volume, 0);
# --- VPT Moving Average ---
def vptAvg = Average(vptValue, avgLength);
# --- Plot VPT Line ---
plot VPT = vptValue;
VPT.SetDefaultColor(Color.MAGENTA);
VPT.SetLineWeight(2);
VPT.AssignValueColor(if vptValue > vptAvg then Color.UPTICK else Color.DOWNTICK);
# --- Plot VPT Average ---
plot VPT_Avg = vptAvg;
VPT_Avg.SetDefaultColor(Color.BLUE);
VPT_Avg.SetLineWeight(1);
VPT_Avg.SetStyle(Curve.SHORT_DASH);
# --- Optional Histogram: VPT - VPT_Avg ---
plot Histogram = if showHistogram then vptValue - vptAvg else Double.NaN;
Histogram.SetPaintingStrategy(PaintingStrategy.HISTOGRAM);
Histogram.SetLineWeight(3);
Histogram.AssignValueColor(if Histogram >= 0 then Color.GREEN else Color.RED);
Histogram.HideTitle();
Histogram.HideBubble();
# --- Optional Zero Line ---
plot ZeroLine = if showZeroLine then 0 else Double.NaN;
ZeroLine.SetDefaultColor(Color.GRAY);
ZeroLine.SetStyle(Curve.SHORT_DASH);
ZeroLine.HideTitle();
ZeroLine.HideBubble();
# === LABELS ===
AddLabel(yes, "VPT: " + Round(VPT, 2), VPT.TakeValueColor());
AddLabel(yes, "VPT Avg (" + avgLength + "): " + Round(VPT_Avg, 2), Color.BLUE);
def bullishSignal = vptValue > vptAvg;
AddLabel(yes, "Trend: " + (if bullishSignal then "Bullish" else "Bearish"),
if bullishSignal then Color.GREEN else Color.RED);
AddLabel(yes, "VPT", Color.WHITE);Original Author Credit
Created by: NiceBreakout
Website: https://www.Nicebreakout.com
Open ThinkorSwim and go to Charts > Studies (fx).
Click Edit Studies > then Create New Study.
Name your indicator (e.g., "My Custom Indicator").
Paste the ThinkScript code into the editor.
Click OK, then Apply to add it to your chart.
What Is the Volume Price Trend (VPT)?
The Volume Price Trend (VPT) is a cumulative technical indicator that adjusts volume based on the percentage change in price.
It helps identify whether volume is supporting price movements.
Shows when buyers (accumulation) or sellers (distribution) are in control.
More accurate than OBV because it uses the size of price moves, not just up/down direction.
How VPT Is Calculated
Start with VPT = 0
Each bar, update:
VPT = Previous VPT + (Percentage Price Change × Volume)
Percentage Change = (Current Close – Prior Close) / Prior Close
For example:
If price goes up 2% on 500K volume → add 10,000 to VPT
If price drops 1.5% on 600K volume → subtract 9,000 from VPT
Over time, VPT builds a running total of volume-driven price momentum.
Key Features of This Enhanced VPT Indicator
This version goes beyond basic VPT with smart upgrades:
Plots the raw VPT line in magenta
Adds a 9-period moving average of VPT (blue dashed line)
Colors the VPT line green-tinted when above average, red-tinted when below
Includes a histogram showing the difference between VPT and its average
Shows a zero line for reference
Displays real-time labels with values and trend bias
Lets you toggle histogram and zero line on or off
How to Use the VPT Indicator
Trend Confirmation
When price and VPT are both rising → uptrend is strong and supported by volume
When price and VPT are both falling → downtrend is real and active
If price moves but VPT doesn’t follow → weak move, possibly a trap or fakeout
Divergence Detection
Bullish divergence: Price makes a lower low, but VPT makes a higher low
→ Selling pressure is fading → potential upward reversal
Bearish divergence: Price makes a higher high, but VPT makes a lower high
→ Buying is weakening → possible drop ahead
Divergences are among the most reliable early signals in trading.
Crossover Signals
When VPT crosses above its moving average → short-term momentum turns bullish
When VPT crosses below its moving average → bearish momentum begins
Use these as triggers when combined with support/resistance or candlestick patterns
Histogram Interpretation
The histogram shows: VPT – VPT Average
Green and growing → bullish momentum accelerating
Green but shrinking → strength fading, pause or pullback possible
Red and growing → selling pressure increasing
Red but shrinking → downtrend may be ending
Think of it like a momentum engine — color and size tell you how strong the move is.
Understanding Large VPT Values (Like -250,343)
You might see VPT at:
-250,343
Don’t worry — this is normal.
VPT is cumulative — it adds up every single bar
It doesn’t reset, so values grow larger over time
A negative number just means more net selling pressure has occurred than buying
A positive number means buying dominance
Focus on the direction and slope, not the absolute number.
For example:
If VPT is rising from -250,343 → momentum is improving
If it keeps falling → downtrend is still strong
It’s like tracking total net money flow — the number gets big, but the trend matters most.
Settings You Can Adjust
avgLength: Default is 9 — this smooths VPT into a short-term average
→ Try 21 for slower, longer-term signals
showHistogram: Set to “yes” or “no” — hide it for a cleaner chart
showZeroLine: Toggle the gray zero line on or off
Use these inputs to customize the look and sensitivity based on your trading style.
Best Practices for Using VPT
Always use VPT with price action — never in isolation
Check higher timeframes first to know the overall trend
Look for divergences at key support or resistance levels
Watch for volume spikes — they often lead to big moves
Combine with RSI, MACD, or moving averages for stronger confirmation
Works well for stocks, ETFs, futures, and crypto
Ideal for:
Swing traders
Momentum traders
Reversal hunters
Confirmation tool in any strategy
What Is the Volume Price Trend (VPT)?
The Volume Price Trend (VPT) is a cumulative technical indicator that adjusts volume based on the percentage change in price.
- It helps identify whether volume is supporting price movements.
- Shows when buyers (accumulation) or sellers (distribution) are in control.
- More accurate than OBV because it uses the size of price moves, not just up/down direction.
How VPT Is Calculated
- Start with VPT = 0
- Each bar, update:
- VPT = Previous VPT + (Percentage Price Change × Volume)
- Percentage Change = (Current Close – Prior Close) / Prior Close
For example:
- If price goes up 2% on 500K volume → add 10,000 to VPT
- If price drops 1.5% on 600K volume → subtract 9,000 from VPT
Over time, VPT builds a running total of volume-driven price momentum.
Key Features of This Enhanced VPT Indicator
This version goes beyond basic VPT with smart upgrades:
- Plots the raw VPT line in magenta
- Adds a 9-period moving average of VPT (blue dashed line)
- Colors the VPT line green-tinted when above average, red-tinted when below
- Includes a histogram showing the difference between VPT and its average
- Shows a zero line for reference
- Displays real-time labels with values and trend bias
- Lets you toggle histogram and zero line on or off
How to Use the VPT Indicator
Trend Confirmation
- When price and VPT are both rising → uptrend is strong and supported by volume
- When price and VPT are both falling → downtrend is real and active
- If price moves but VPT doesn’t follow → weak move, possibly a trap or fakeout
Divergence Detection
- Bullish divergence: Price makes a lower low, but VPT makes a higher low
→ Selling pressure is fading → potential upward reversal - Bearish divergence: Price makes a higher high, but VPT makes a lower high
→ Buying is weakening → possible drop ahead
Divergences are among the most reliable early signals in trading.
Crossover Signals
- When VPT crosses above its moving average → short-term momentum turns bullish
- When VPT crosses below its moving average → bearish momentum begins
- Use these as triggers when combined with support/resistance or candlestick patterns
Histogram Interpretation
- The histogram shows: VPT – VPT Average
- Green and growing → bullish momentum accelerating
- Green but shrinking → strength fading, pause or pullback possible
- Red and growing → selling pressure increasing
- Red but shrinking → downtrend may be ending
Think of it like a momentum engine — color and size tell you how strong the move is.
Understanding Large VPT Values (Like -250,343)
You might see VPT at:
-250,343
Don’t worry — this is normal.
- VPT is cumulative — it adds up every single bar
- It doesn’t reset, so values grow larger over time
- A negative number just means more net selling pressure has occurred than buying
- A positive number means buying dominance
Focus on the direction and slope, not the absolute number.
For example:
- If VPT is rising from -250,343 → momentum is improving
- If it keeps falling → downtrend is still strong
It’s like tracking total net money flow — the number gets big, but the trend matters most.
Settings You Can Adjust
- avgLength: Default is 9 — this smooths VPT into a short-term average
→ Try 21 for slower, longer-term signals - showHistogram: Set to “yes” or “no” — hide it for a cleaner chart
- showZeroLine: Toggle the gray zero line on or off
Use these inputs to customize the look and sensitivity based on your trading style.
Best Practices for Using VPT
- Always use VPT with price action — never in isolation
- Check higher timeframes first to know the overall trend
- Look for divergences at key support or resistance levels
- Watch for volume spikes — they often lead to big moves
- Combine with RSI, MACD, or moving averages for stronger confirmation
- Works well for stocks, ETFs, futures, and crypto
Ideal for:
- Swing traders
- Momentum traders
- Reversal hunters
- Confirmation tool in any strategy
Note: This indicator code is provided free for educational purposes. Test thoroughly before using in live trading.
Legal Disclaimer & Risk Warning
Educational Purpose: This code is provided for educational and informational purposes only. It does not constitute financial, investment, or trading advice.
No Performance Guarantee: Past performance is not indicative of future results. Trading involves substantial risk, including potential loss of capital.
Test Thoroughly: Always test indicators in a paper trading environment before using real money. Verify compatibility with your platform version.
Use at Your Own Risk: You are solely responsible for your trading decisions. We are not liable for any losses resulting from use of this code.
Attribution: If you share or modify this code, please maintain proper attribution to the original author.
By using this code, you acknowledge understanding and acceptance of these terms.